Langfuse is a favorite among AI developers because it lets you trace user prompts, model responses, and system performance in one place. It also supports self-hosting, giving you full control over your data and how everything runs, with zero vendor lock-in.
Even so, there are a few things that make some devs look elsewhere:
* Setting up self-hosting can be complex because it depends on services like ClickHouse, Redis, and S3.
* Even after setup, keeping it running smoothly takes some effort; if events don’t show up in the UI, you may need to dig through logs and storage layers to find out why.
* Some users report the interface can feel cluttered or hard to follow.
* It versions the prompt and some configuration parameters, but not the surrounding code context, so it might not suit workflows where prompts and logic are tightly coupled.
In this article, we cover 6 top alternatives to Langfuse, including Lilypad, our open-source platform built for developers. Unlike tools that only version prompts, Lilypad versions your entire function, so you can track logic, not just text.
It also includes built-in OpenTelemetry for tracking cost and latency, along with easy annotations and side-by-side version comparisons.
Below we take a closer look at each option and what it brings to the table.
## 1. Lilypad: The Developer’s Framework for Reproducible LLM Workflows
[Lilypad](/docs/lilypad) is a user-friendly open source prompt engineering framework. Unlike other solutions that focus only on the prompt text, Lilypad treats every LLM call as a complete software artifact, capturing the entire context that influences the output.
With Lilypad, you get:
* Automatic capture of traces, inputs/outputs, cost, and latency for every LLM call with zero configuration.
* Automatic versioning of your prompts as you make changes; no manual commits needed.
* Full versioning of everything that influences LLM output quality, including the surrounding code, not just the text prompt.
* Easy and lightweight self-hosting options for developers wanting a fast local setup or minimal cloud deployment, avoiding the complexity of distributed storage and parallel services.
Below, we explain how Lilypad works:
### Trace Everything From the First Line of Code
LLM outputs are non-deterministic, which is why it's important to take a snapshot of the exact version of the code that was used to produce an output. This reproducibility is necessary for proper [LLM evaluation](/blog/llm-evaluation).
Tools that version only the raw prompt text are missing crucial context. With LLMs, the output isn't just shaped by the prompt; it's the result of a blend of:
* The control flow or logic of how the model is queried.
* Call parameters like `model`, `temperature`, `top_p`, or `max_tokens`.
* Pre- and post-processing such as how inputs are prepared or outputs interpreted.
* Surrounding code like helper functions, embedded data, or state from other parts of your system.
Even a minor change to model settings, input structure, or surrounding logic can alter the outcome, so if you're only versioning the prompt, you lose the ability to reproduce results, understand why something worked, or pinpoint what went wrong when it doesn't.
Lilypad solves this by versioning the entire function closure, which is a full snapshot of everything that influenced the output, not just the prompt string. It treats LLM calls as proper software artifacts that are trackable, reproducible, and safe to iterate on.
It also encourages developers to encapsulate LLM calls in Python functions so that every aspect of the interaction, including the prompt, inputs, model settings, and any surrounding logic, can be versioned, traced, and evaluated as a single, reproducible unit.
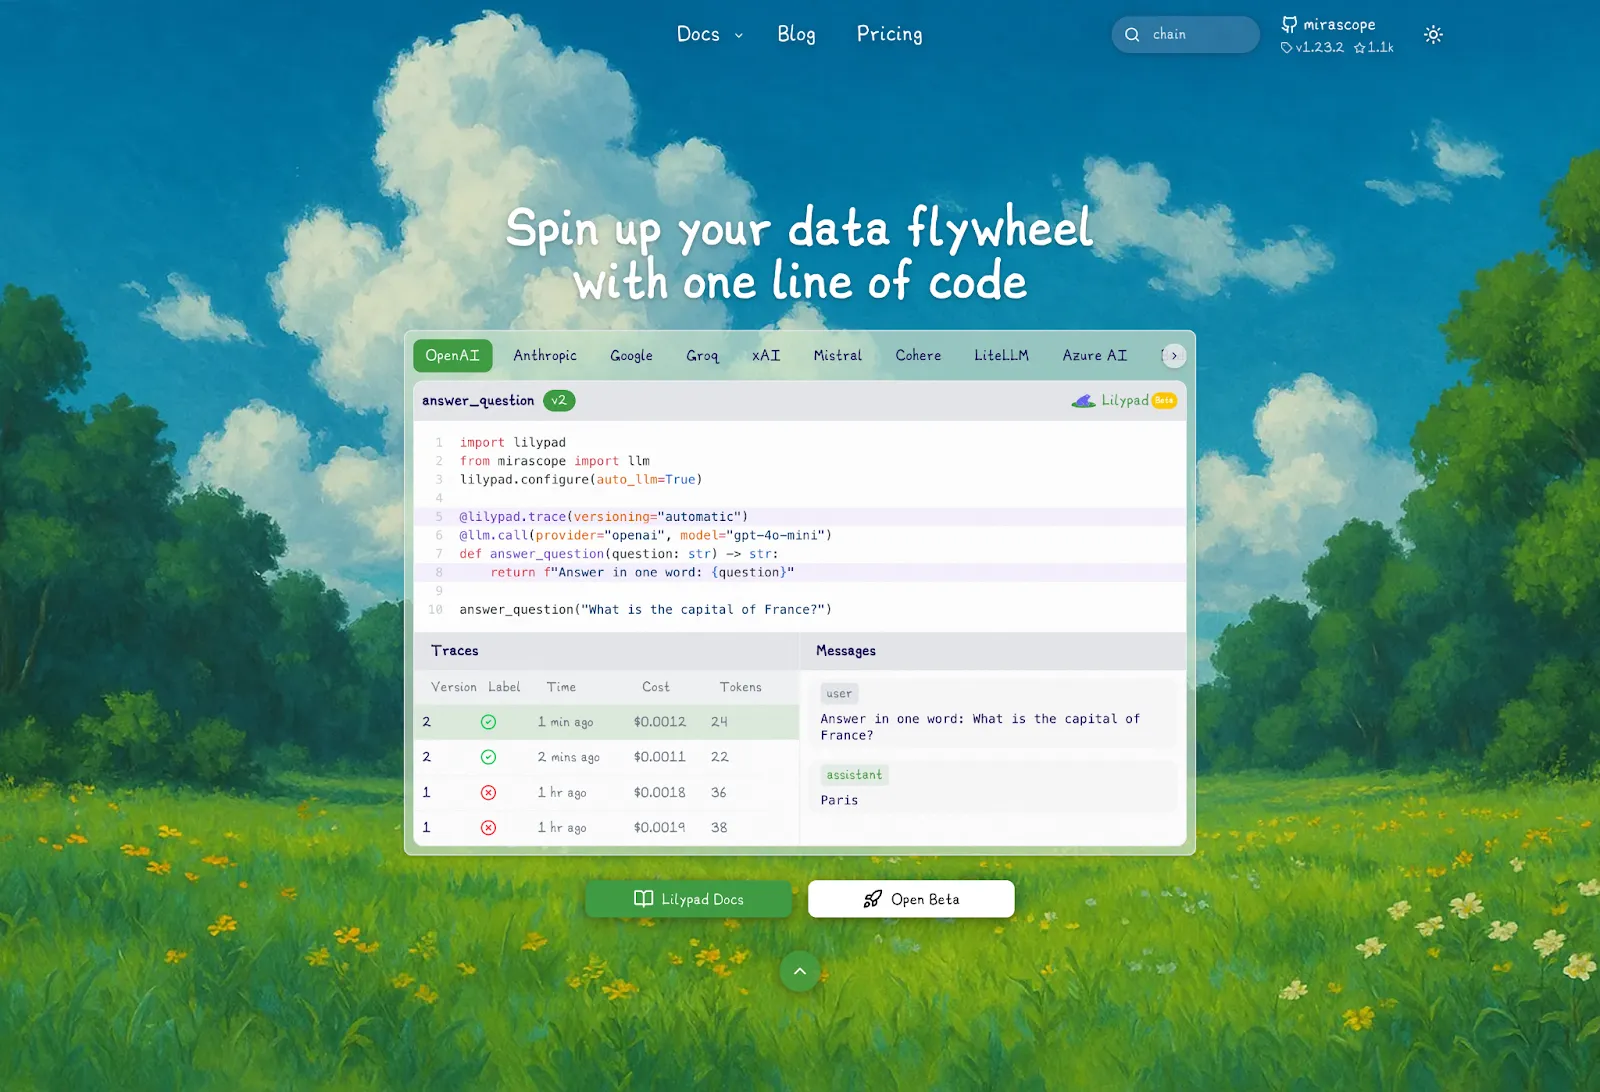
Just use `@lilypad.trace(versioning="automatic")` on your call functions to automatically capture arguments, return values, and internal changes within the function closure:
```python
import lilypad
from mirascope import llm
@lilypad.trace(versioning="automatic") # [!code highlight]
@llm.call(provider="google", model="gemini-2.0-flash-001")
def answer_question(question: str) -> str:
return f"Answer this question: {question}"
response = answer_question("What is the capital of France?")
print(response)
# > The capital of France is Paris.
```
The results are shown in Lilypad's Traces tab. If you're using a Mirascope LLM call, the versioned function will also be available in the playground (explained in the next section), which allows you to delegate prompt editing and evals to domain experts.
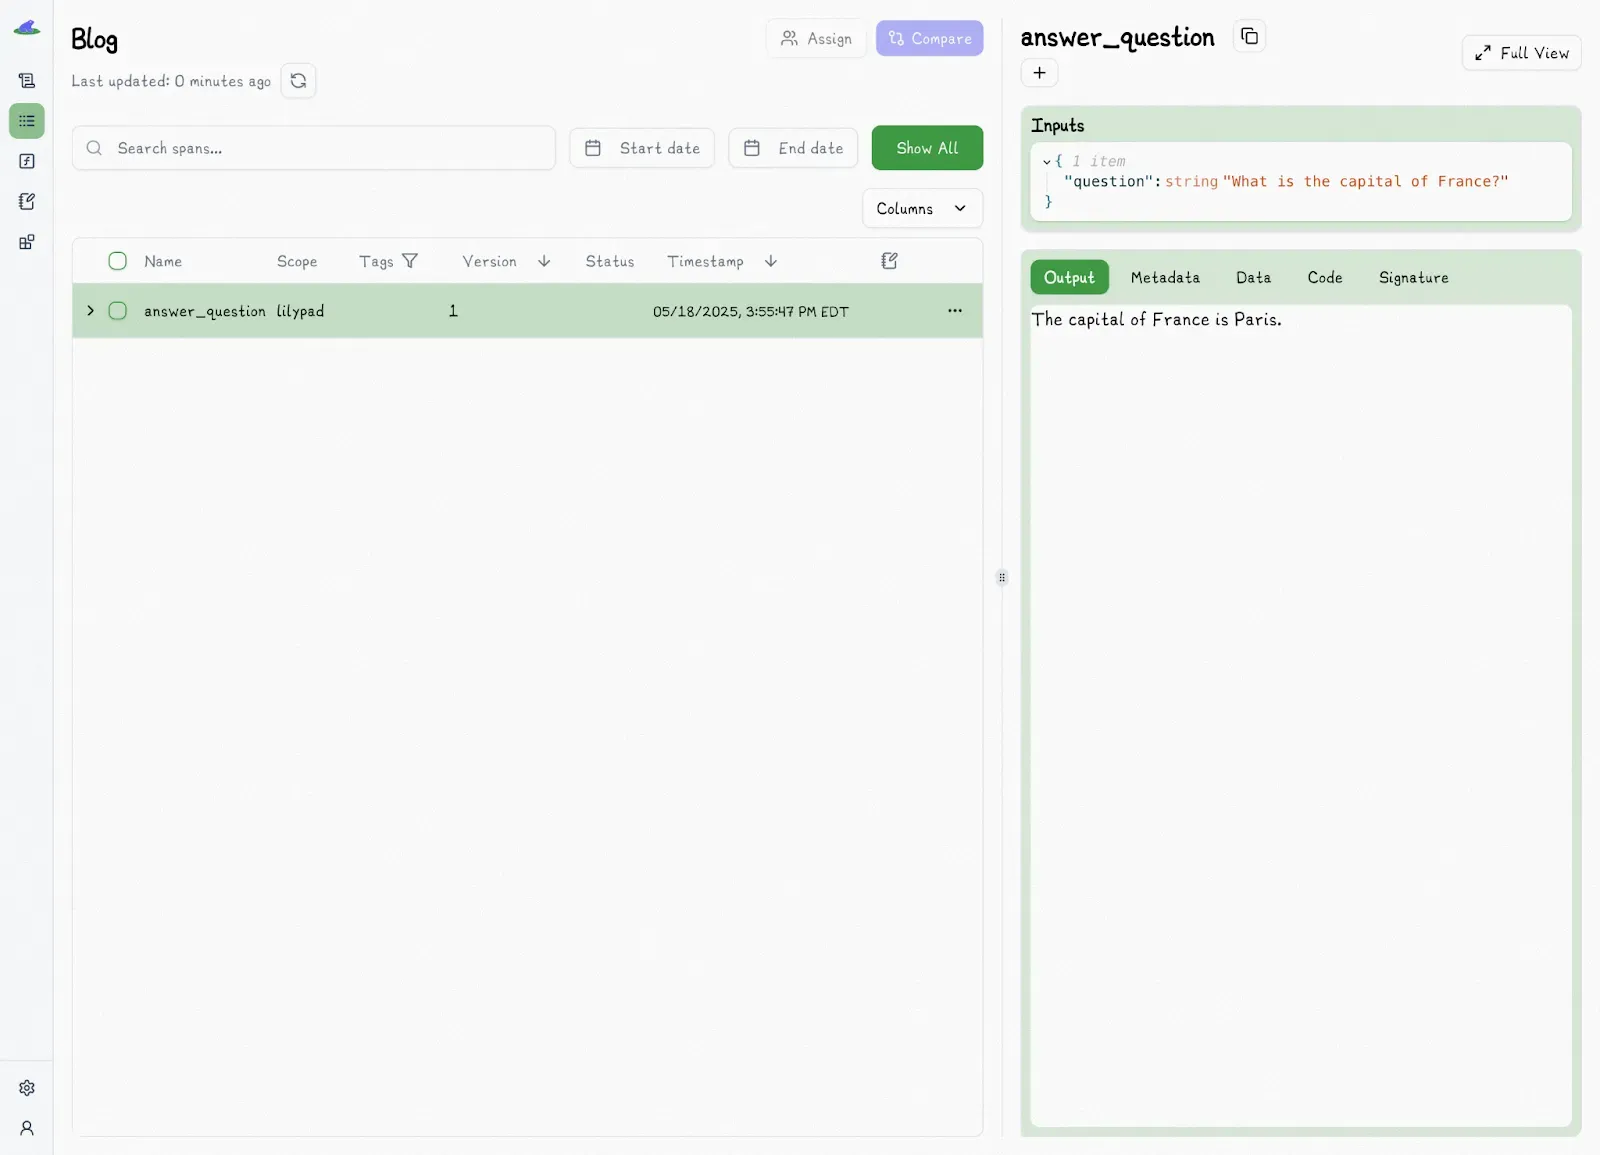
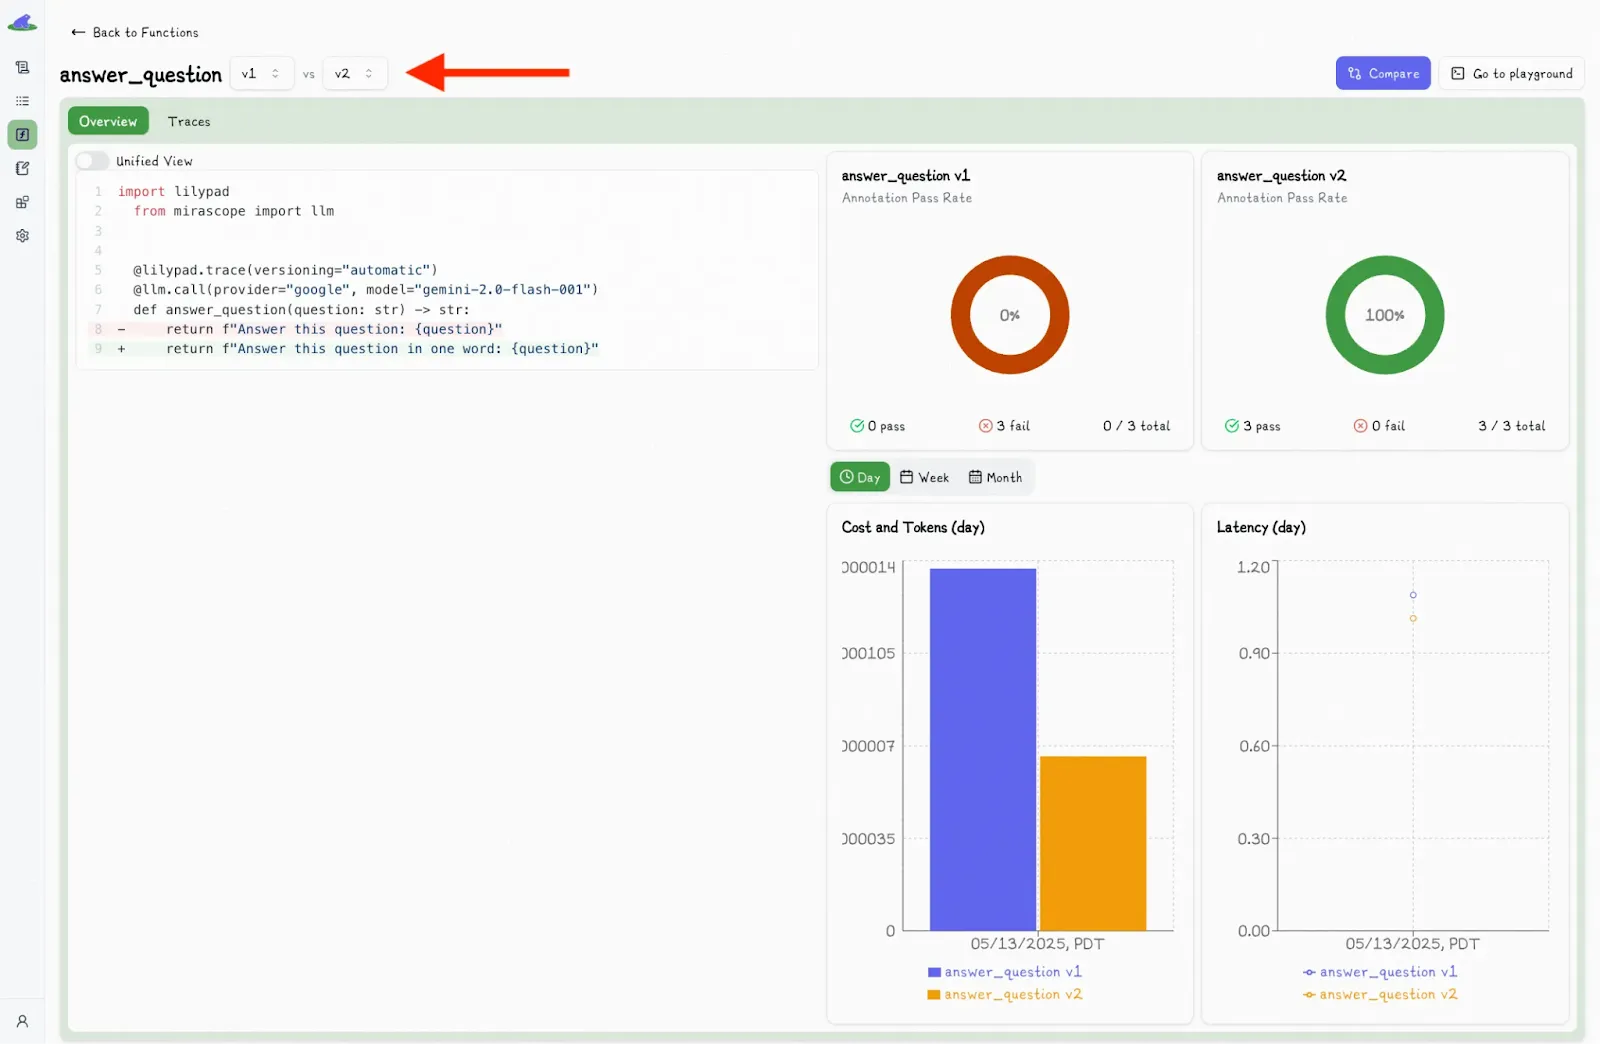
When the code above is first run, it creates a nested trace and is logged as version 1:
Changing anything in the function or the prompt and then running the code again automatically produces version 2:
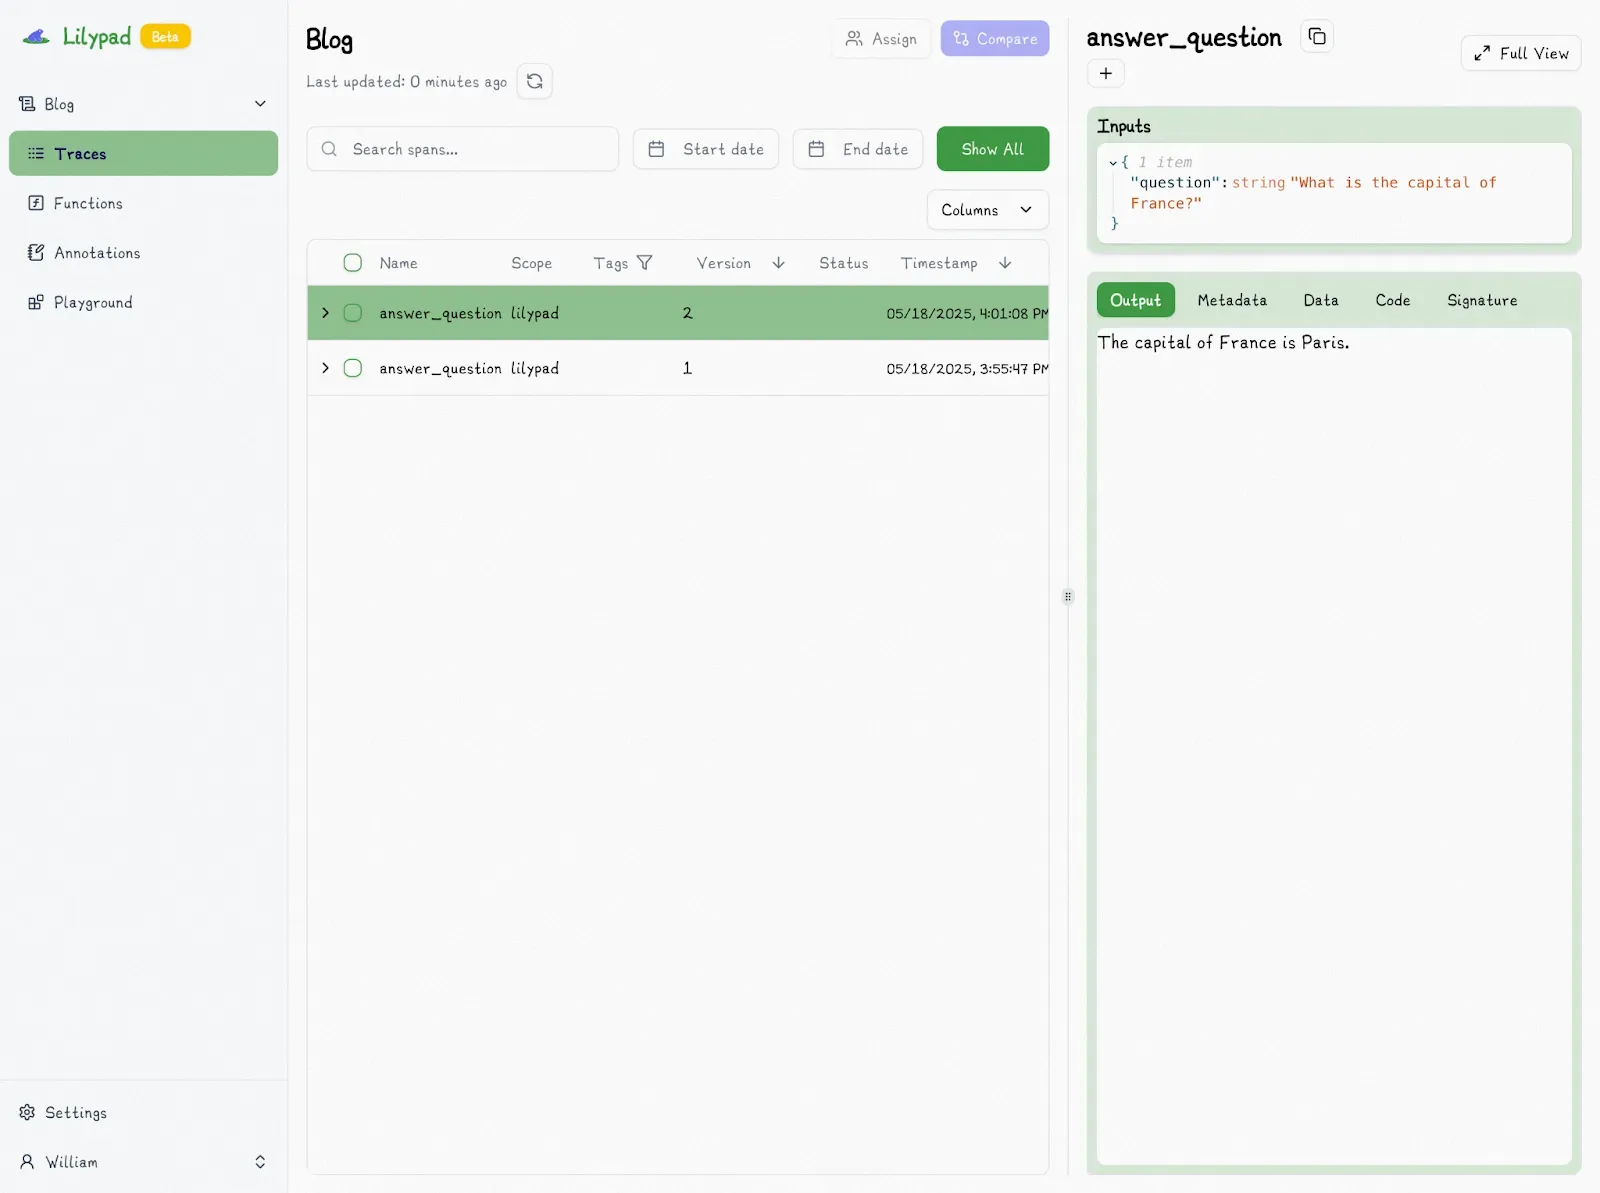
Note that if you change a function so that it's identical to any previous version, the version isn't incremented.
You can also compare function versions by clicking the “Compare” button:
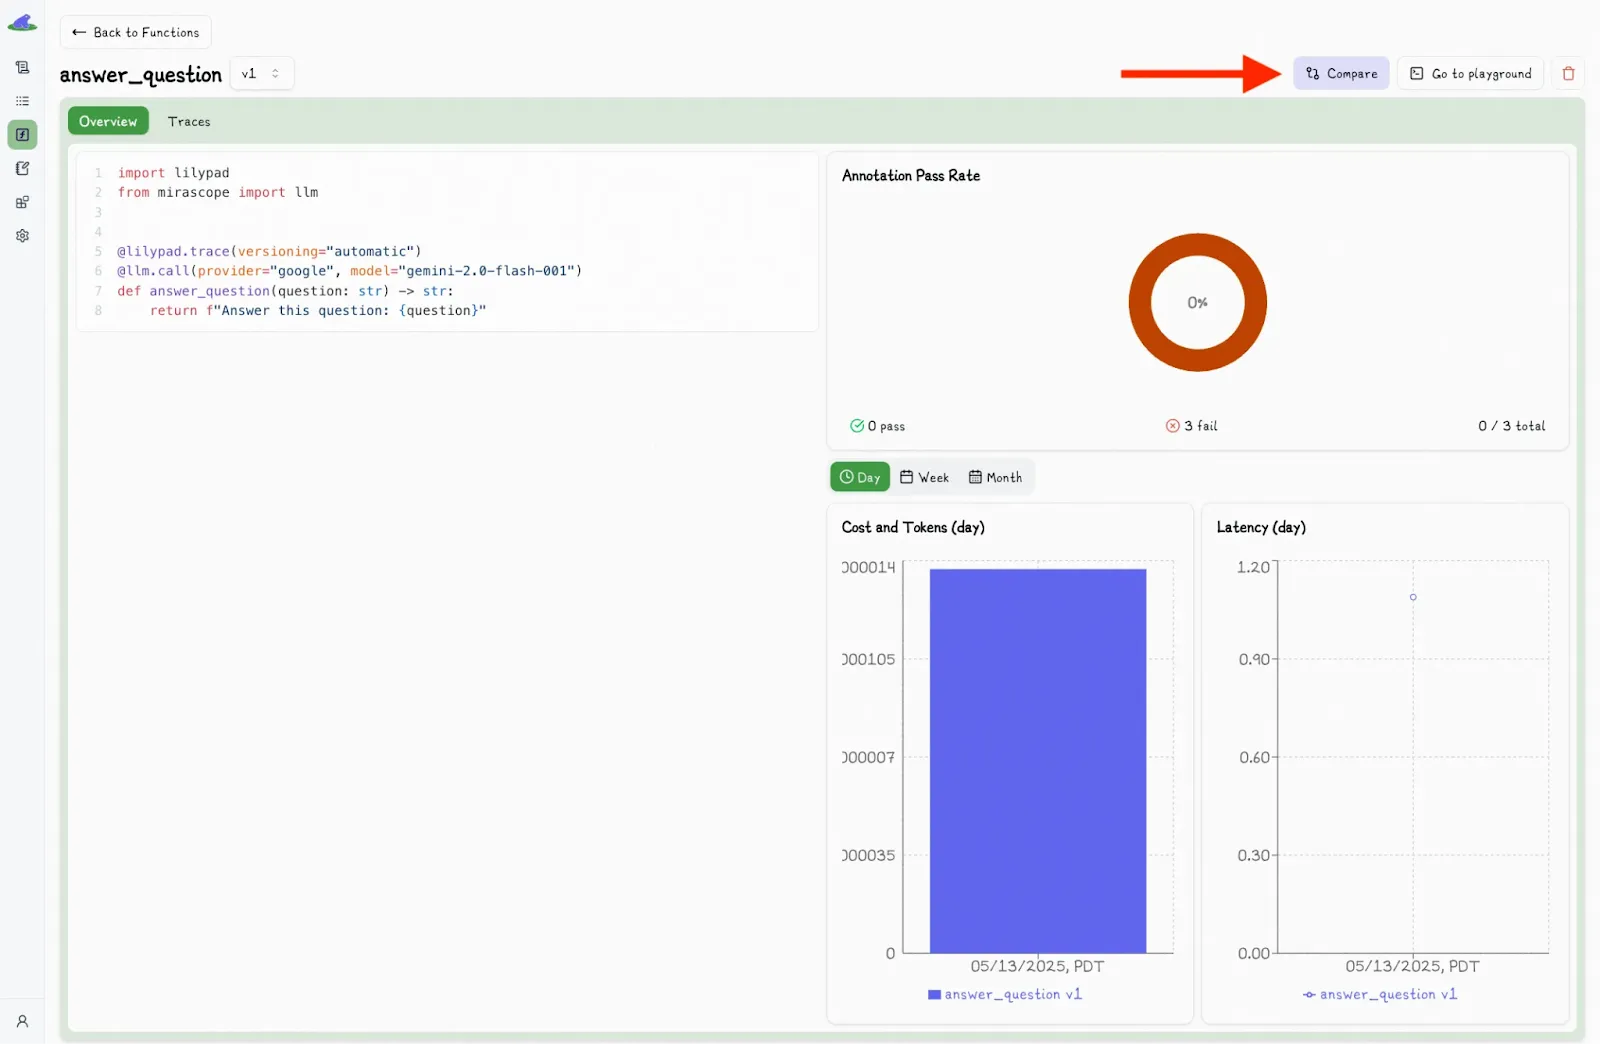
This toggles a second dropdown menu, where you can select another version and view the differences side-by-side.
Lilypad also supports A/B testing and rollbacks, since every function run creates a trace with metadata.
Accessing any version using `.version(n)()` allows you to compare it with another, you can use it in statements like:
```python
response = answer_question.version(2)("What is Saturn's largest moon?")
```
This allows you to run different versions of the same function and it makes A/B testing convenient. Just run each version for a subset of users and evaluate which one is better.
### No-Code Prompt Experimentation for SMEs
Lilypad’s playground provides a no-code browser environment and safe collaboration model that gives domain experts the ability to create, change, and hot swap prompts without involvement from developers so they don't need to redeploy the code.
Prompt changes in the playground are sandboxed by default:
* They don’t affect live code unless deliberately synced by an engineer.
* Running a prompt in the playground doesn't require a pull request, merge, or redeploy.
* Outputs are recorded and versioned, just like any code-executed trace.
* Annotations, discussions, and comparisons are linked directly to runs.
The playground supports type-safe prompt templates, letting you write markdown-style prompts with embedded, typed variable placeholders.
The templates:
* Are mapped to function signatures for strong typing and reproducibility.
* Are backed by a Python function with type-safe arguments (the system ensures that inputs provided in the playground match the function's schema).
* Prevent injection bugs, missing parameters, or incorrect input formats.
Lilypad keeps your prompts and code working together with no brittleness. While other [LLM tools](/blog/llm-tools) split prompts off into separate systems, Lilypad versions the whole function so that what you test in the playground is the same code you use in production. Even if Lilypad goes down, your code will still run.
Each time an [LLM prompt](/blog/llm-prompt) is run in the playground, Lilypad captures a full trace, just like it does for production code. This trace includes all inputs, outputs, call settings, model metadata, and any annotations or labels. The result is a transparent, inspectable snapshot of that exact run.
You can review it in the Traces tab, where each span is timestamped, costed, and ready to annotate or compare:
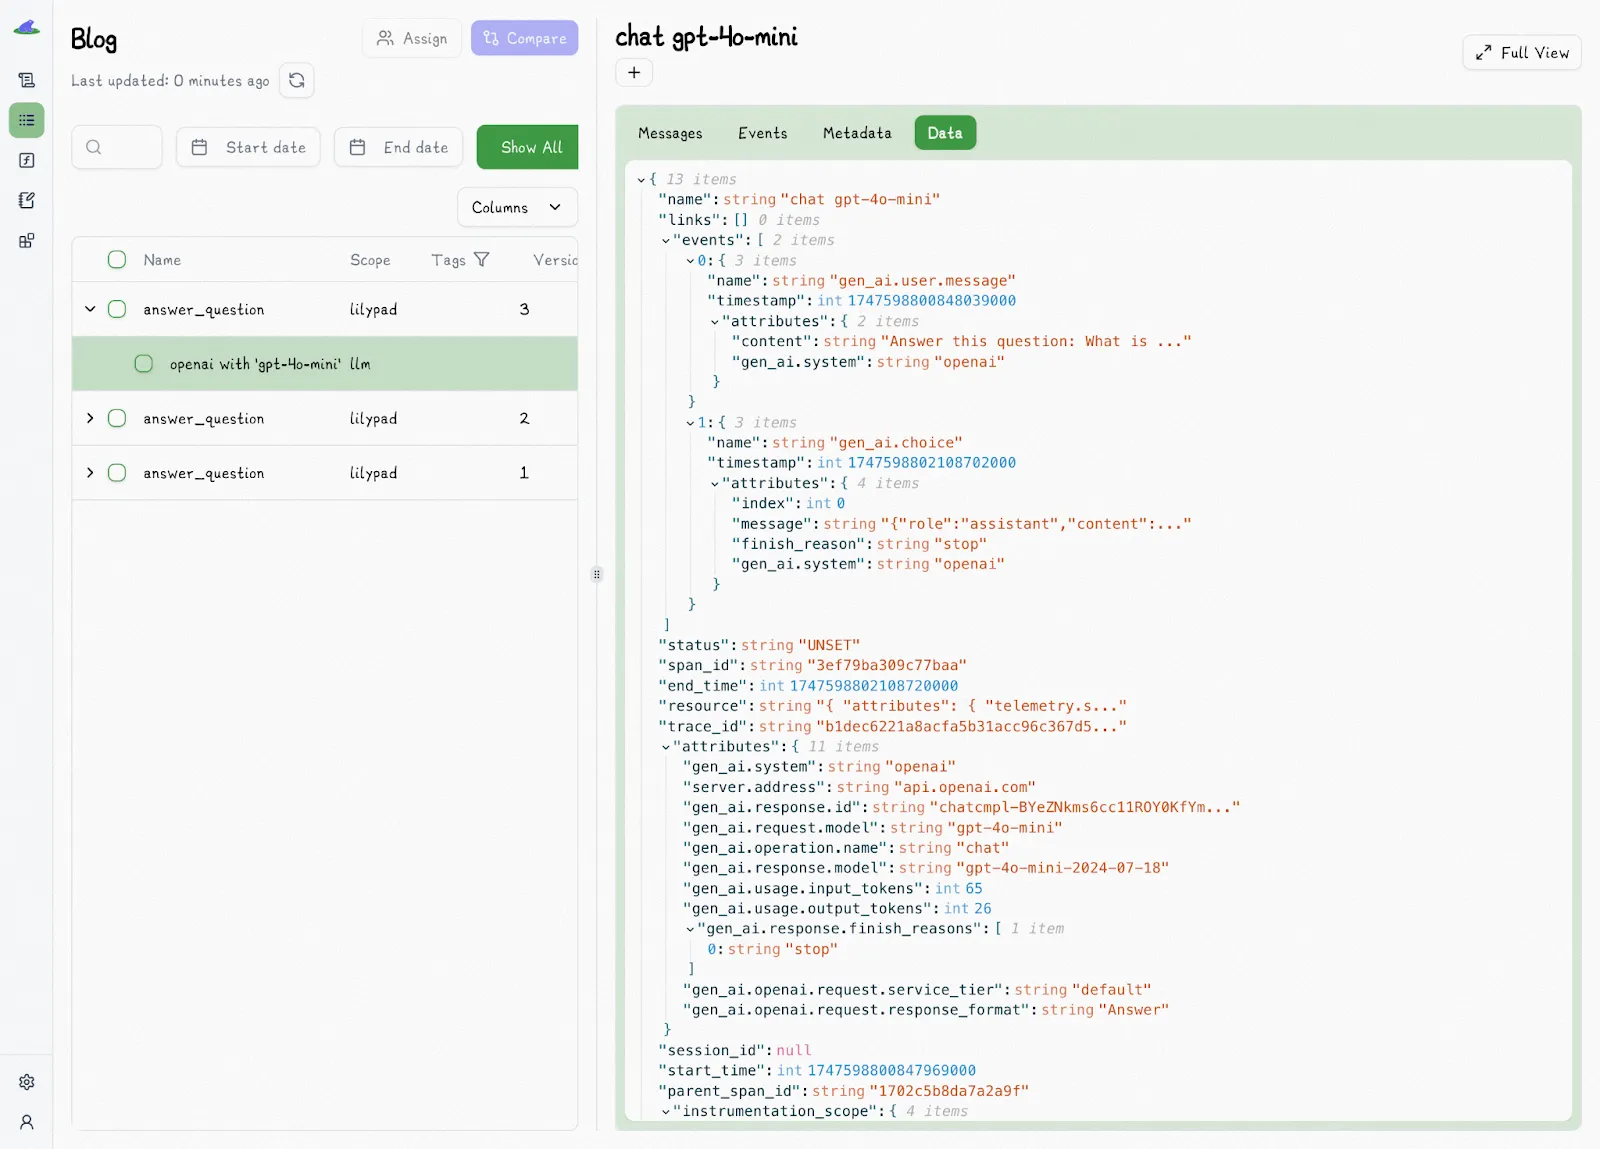
Lilypad uses the [OpenTelemetry Gen AI spec](https://opentelemetry.io/) to trace every LLM call with standardized, structured metadata, making your runs easy to debug, visualize, and analyze across tools. Playground users can also quickly annotate traces, adding pass/fail labels, reasoning, and comments, right from the trace viewer, as we’ll see in the next section.
### Evaluating LLM Outputs
LLMs’ non-determinism makes traditional unit tests a poor fit. Evaluation isn’t a one-and-done task: it’s an ongoing process, constantly evolving as new edge cases emerge. What counts as a “correct” output is often contextual and relies on human judgment, rather than being a simple binary right-or-wrong decision.
Fuzzy metrics work best, especially pass/fail labels, which offer a clear, actionable signal. Overly granular scoring systems like one to five stars tend to reduce clarity and consistency, adding noise without increasing reliability.
The Annotation Queue lets you easily annotate traces and supports quick, inline tagging as “Pass” or “Fail,” making it simple to mark whether an output is good enough. If needed, you can assign someone to handle the annotations, helping set up a repeatable QA process for [LLM integration](/blog/llm-integration).
Each review stays connected to the exact version of the function, the prompt, the inputs, and the model settings that were used. You can also include a reason for your decision and explain the criteria you applied; this helps others understand how you made your call, especially when judgment is involved.
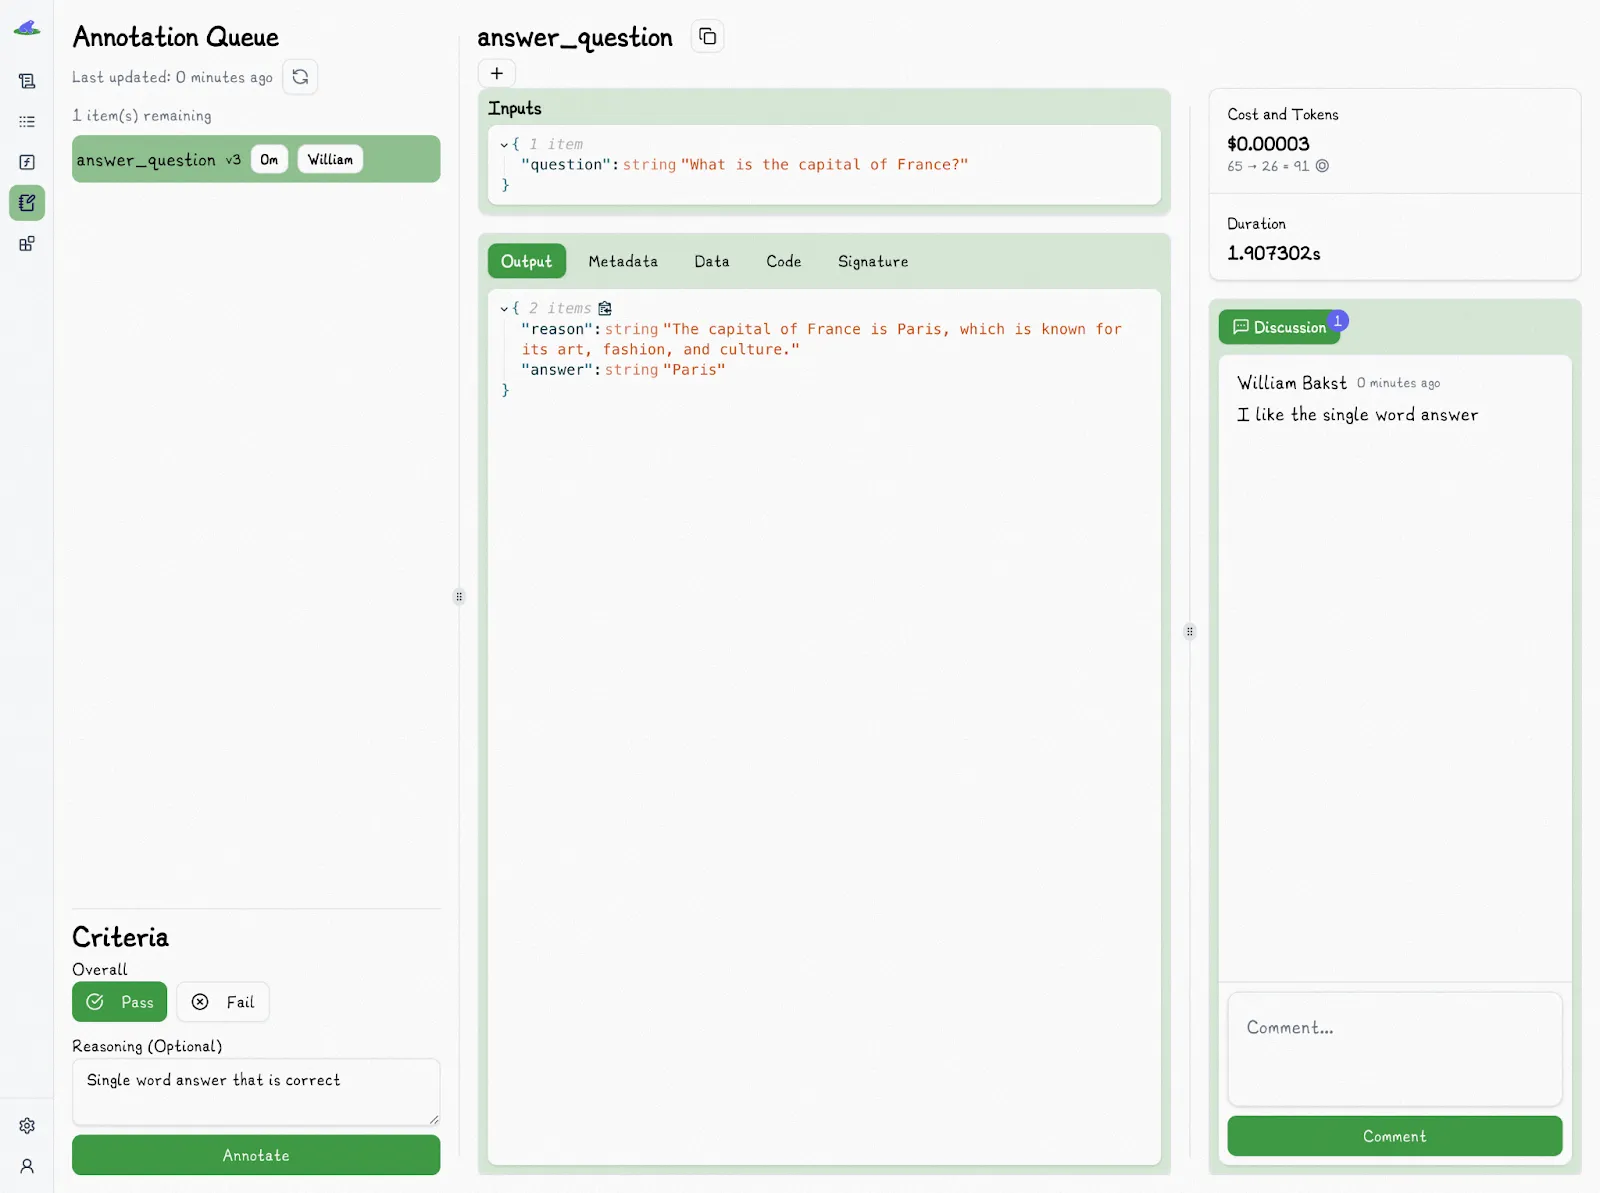
To keep things fair, Lilypad hides any existing annotations while you’re reviewing a trace so your opinion isn’t influenced.
In the codebase, you can label outputs on the spot (right after a function runs) by setting `mode="wrap"` in the `@lilypad.trace` decorator. When enabled, the function's return type is transformed into a `Traced[R]` object, which includes both the original return value and methods for interacting with the trace, like `.annotate()`:
```python
from google.genai import Client
import lilypad
client = Client()
lilypad.configure()
@lilypad.trace(name="Recommend Book", versioning="automatic", mode="wrap") # [!code highlight]
def recommend_book(genre: str) -> str | None:
response = client.models.generate_content(
model="gemini-2.0-flash-001",
contents=f"Recommend a good {genre} book.",
)
return response.text
trace: lilypad.Trace[str | None] = recommend_book("science fiction") # [!code highlight]
print(trace.response) # original response
# > You should read 'Dune' by Frank Herbert.
annotation = lilypad.Annotation( # [!code highlight]
label="pass", # [!code highlight]
reasoning="The recommendation fits the genre and is a well-known classic.", # [!code highlight]
data=None, # [!code highlight]
type=None, # [!code highlight]
) # [!code highlight]
trace.annotate(annotation) # [!code highlight]
```
Evaluating outputs directly in the code means you don’t have to switch to the application UI, making it ideal for automated tests, scripted evaluations, integrating annotations into CI/CD workflows, or even enabling end users to annotate traces directly as they use your product.
Manual reviews are just the starting point, and as you build up a solid base of annotations, you can train an [LLM\-as-a-judge](/blog/llm-as-judge) to handle much of the labeling for you. This shifts your team’s role from tagging outputs to simply verifying them, which speeds up every [prompt evaluation](/blog/prompt-evaluation) while still keeping humans in the loop for accuracy and trust.
You’ll still want to spot-check the results, though. That way, you can catch mistakes, fine-tune the judge, and keep quality high. And the more consistently you annotate, whether in the UI or directly in code, the better. Each labeled example helps build a stronger dataset for comparing versions and spotting regressions over time, which allows you turn outputs into measurable progress.
### Track Every Prompt Like Code
Lilypad gives you full visibility into every LLM call: prompt, parameters, and outputs. Whether you're debugging, improving, or collaborating, you get structured, versioned records for your [LLM applications](/blog/llm-applications) of exactly what ran and why.
[Sign in with GitHub](https://lilypad.mirascope.com/) to explore the Lilypad for free, or [self-host](/docs/lilypad/getting-started/self-hosting) in minutes for local control. Lilypad plays nicely with [Mirascope](https://github.com/mirascope/mirascope) and other Python libraries, making it easy to drop into your existing stack.
## 2. LangSmith: Build, Debug, and Evaluate with LangChain’s Companion Platform
[LangSmith](https://www.langchain.com/langsmith) is a closed source platform for LLM observability, testing, and evaluation, excelling in LangChain\-centric environments and offering comprehensive team features and integrations.
The platform captures every run that you manually save, logging inputs, outputs, and intermediate steps. Developers can inspect traces, review model decisions, and diagnose errors in a detailed UI.
It provides dashboards and metrics for monitoring production apps, tracking latency, API calls, token usage, and custom business metrics. Alerts can also be set for anomalies.
LangSmith allows you to use datasets for evaluating outputs and supports batch evaluations. It also enables comparison using AI judges, reference answers, custom evaluators, or human feedback and integrates with CI pipelines.
It offers LangChain Hub for publishing your prompts publicly; however, these prompts are text-only and don't include the surrounding code.
Available as a managed cloud service or self-hosted with a paid enterprise license, LangSmith is a closed-source product. Paid plans start at around $40 per seat per month; you pay $0.50 per 1,000 base traces (with 14-day retention).
## 3. Helicone: Monitor, Debug, and Optimize, All in One Place
[Helicone](https://www.helicone.ai/) is an open source platform built for observability and management of LLM applications. It offers a full suite of tools to monitor, debug, and optimize AI agent performance across major providers like OpenAI, Anthropic, and Azure. With real-time request logging and tracing, Helicone gives developers a clear view into their system’s behavior, helping them identify performance bottlenecks, control costs, and experiment with prompts more effectively.
The platform includes a production-ready dashboard for tracking key metrics such as latency, utilization, and spend, all broken down across providers and requests. It also supports prompt versioning, experiment tracking, and evaluation workflows to help teams iterate faster.
Helicone works via a simple proxy-based integration that requires minimal code changes and no additional dependencies. It supports tracking of users and sessions through customizable properties, and comes with built-in caching and retry logic to handle rate limits and improve throughput.
Deployment is flexible: you can run it in the cloud or self-host on-premise using Helm charts. The free plan is great for getting started, while paid plans begin at $25/month and include unlimited requests, advanced caching, and rate-limited user management features.
## 4. LangWatch: Integrated Evaluation from Deploy to Feedback Loop
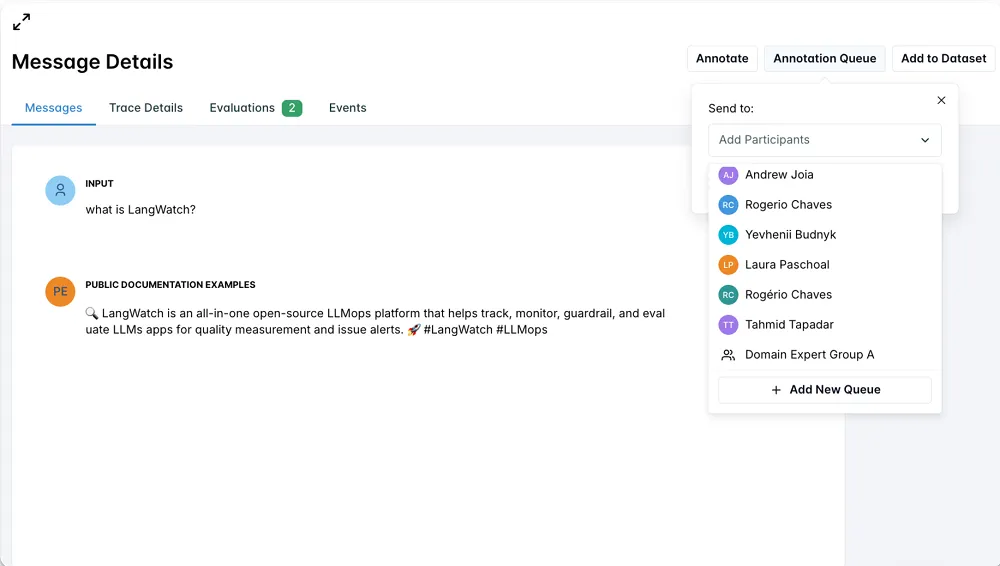
[LangWatch](https://langwatch.ai/) is a platform designed for observability, evaluation, and optimization of LLM\-powered applications. It offers full-stack tracing of prompts, variables, tool invocations, and agent interactions using OpenTelemetry, giving users real-time visibility into token usage, latency, and cost.
The platform delivers granular observability through features like user and session tracking, along with detailed insights into application behavior and performance. LangWatch also supports automated evaluation workflows, including LLM\-as-a-Judge scoring, hallucination detection, and regression testing that can be triggered by code deployments or offline jobs.
Its visual interface makes evaluation and prompt tuning accessible to both developers and non-technical users. LangWatch supports low- and no-code workflows, prompt versioning, and integrates seamlessly with [LLM frameworks](/blog/llm-frameworks) like DSPy. For more advanced needs, it offers custom metrics, domain-specific annotations, and human-in-the-loop feedback mechanisms.
Collaboration is centralized and designed to support mixed teams, with real-time alerts and broad provider integrations to keep everyone in sync. Paid plans start at approximately $60 per user per month and include 20,000 traces, with an additional $5 charged for every 10,000 extra traces.
## 5. Phoenix: Open-Source Observability for RAG Workflows
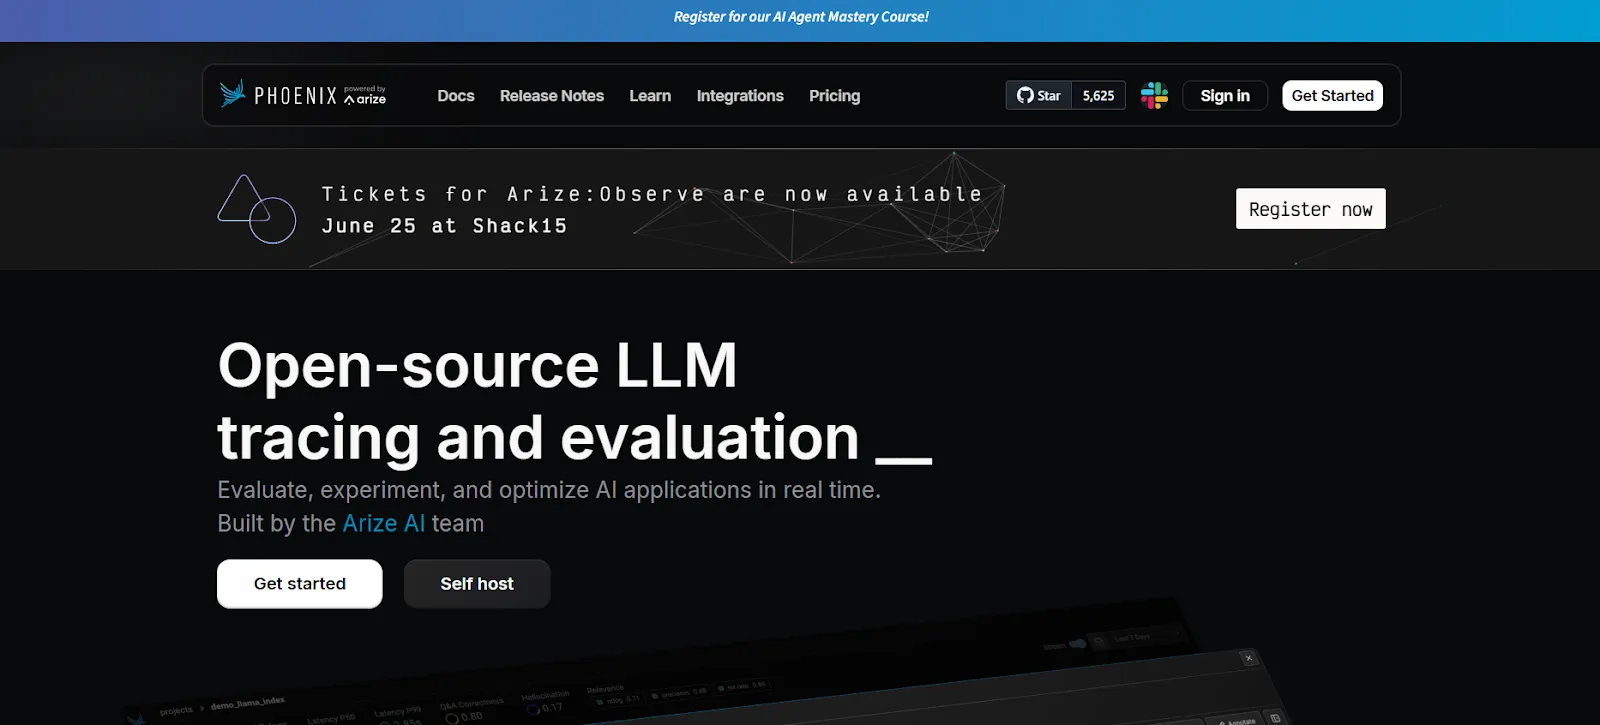
[Phoenix](https://phoenix.arize.com/) (by Arize AI) is an open source observability and evaluation platform built specifically for LLM applications, with a strong focus on experimental and development workflows, particularly in retrieval augmented generation (RAG) scenarios. It comes with built-in evaluation metrics designed to assess correctness, hallucination, and toxicity. While these metrics provide a solid foundation for quality assessment, they’re fixed, meaning teams with more specialized or granular evaluation needs may need to extend Phoenix’s functionality.
One of Phoenix’s key strengths is its support for collecting user feedback on model outputs, enabling continuous improvement through iteration. It integrates well with popular LLM development frameworks such as LangChain and LlamaIndex, and provides Python SDKs and callbacks that simplify observability in more complex workflows.
Phoenix also features a web interface for reviewing evaluation results and trace data. This UI is particularly useful for diagnosing issues and analyzing output quality for any [RAG application](/blog/rag-application) or pipeline.
However, it does have some limitations. Phoenix doesn’t include built-in tools for managing or versioning prompts, so teams must handle those tasks separately. Additionally, it lacks full-scale LLM usage monitoring capabilities, which may make it less suitable for teams needing robust, production-grade observability.
Despite these gaps, Arize Phoenix is accessible, offering free plans for both self-hosted and managed cloud deployments, including up to 10 GB of storage.
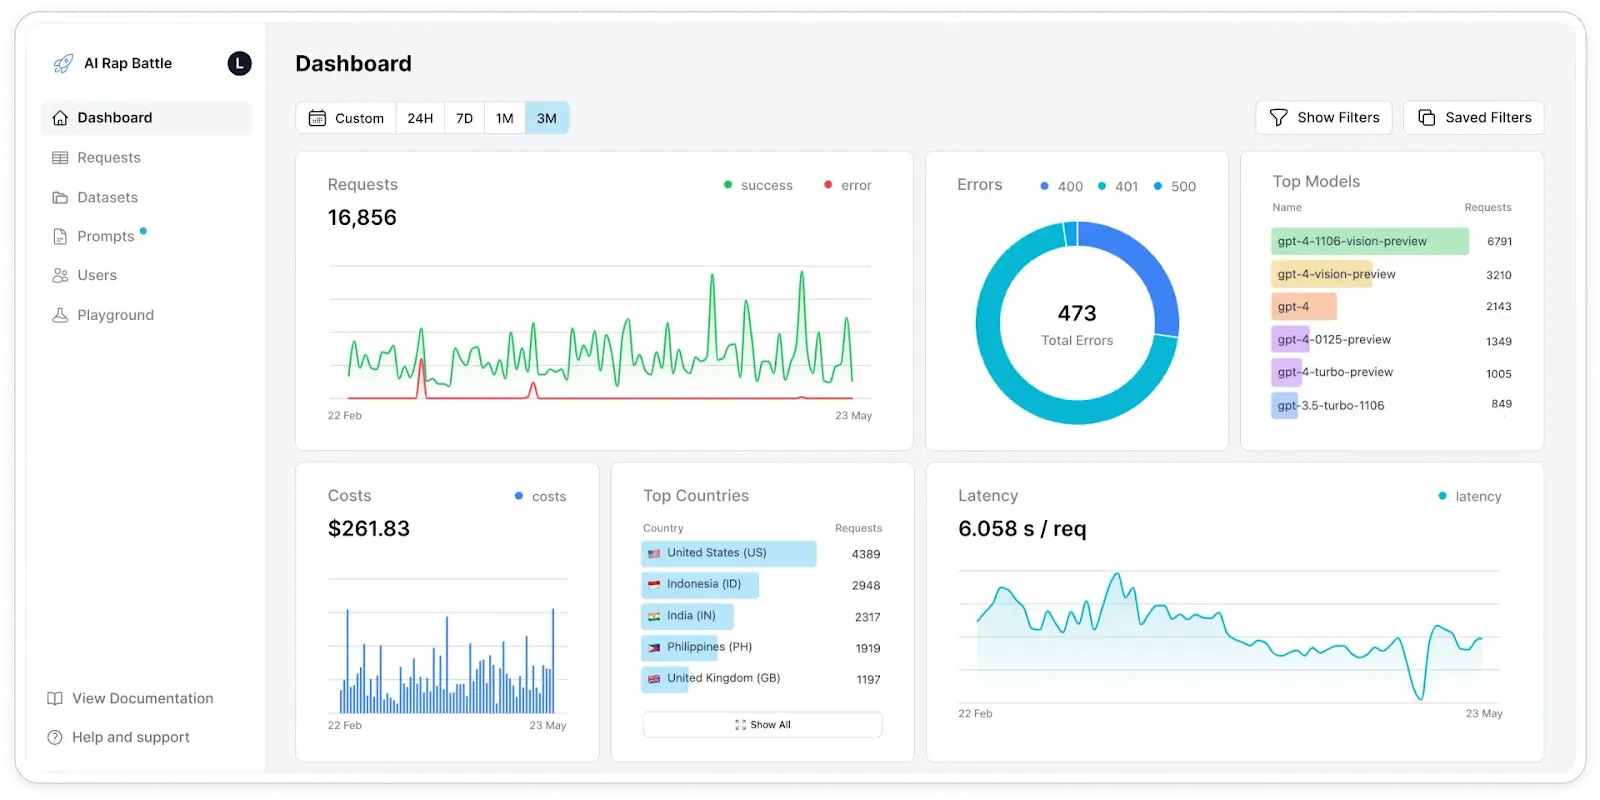
## 6. Lunary: Analytics-Driven LLM Development

[Lunary](https://lunary.ai/) is an open source, self-hostable platform for full-stack observability, analytics, evaluation, and prompt management in LLM\-powered applications. You can deploy it on your own infrastructure, giving you complete control over data privacy, system behavior, and customization.
In Lunary, every LLM call is tracked, along with its response and metadata, using full-span tracing. This makes it easier to debug unexpected model behavior, trace performance regressions, and understand how changes affect output. The platform includes built-in version control for prompts, allowing teams to iterate, experiment, and compare results across versions without losing historical context or overwriting previous work.
For teams focused on cost-efficiency, Lunary offers detailed reporting on token usage and lets you configure custom pricing for different models, making it easier to manage budgets and optimize which models you use.
Paid plans start at $20 per user per month and include 50,000 tracked events, unlimited projects, full history access, and an integrated AI playground for testing and development.
## 7. HoneyHive: Visualize, Evaluate, and Improve Your AI Stack
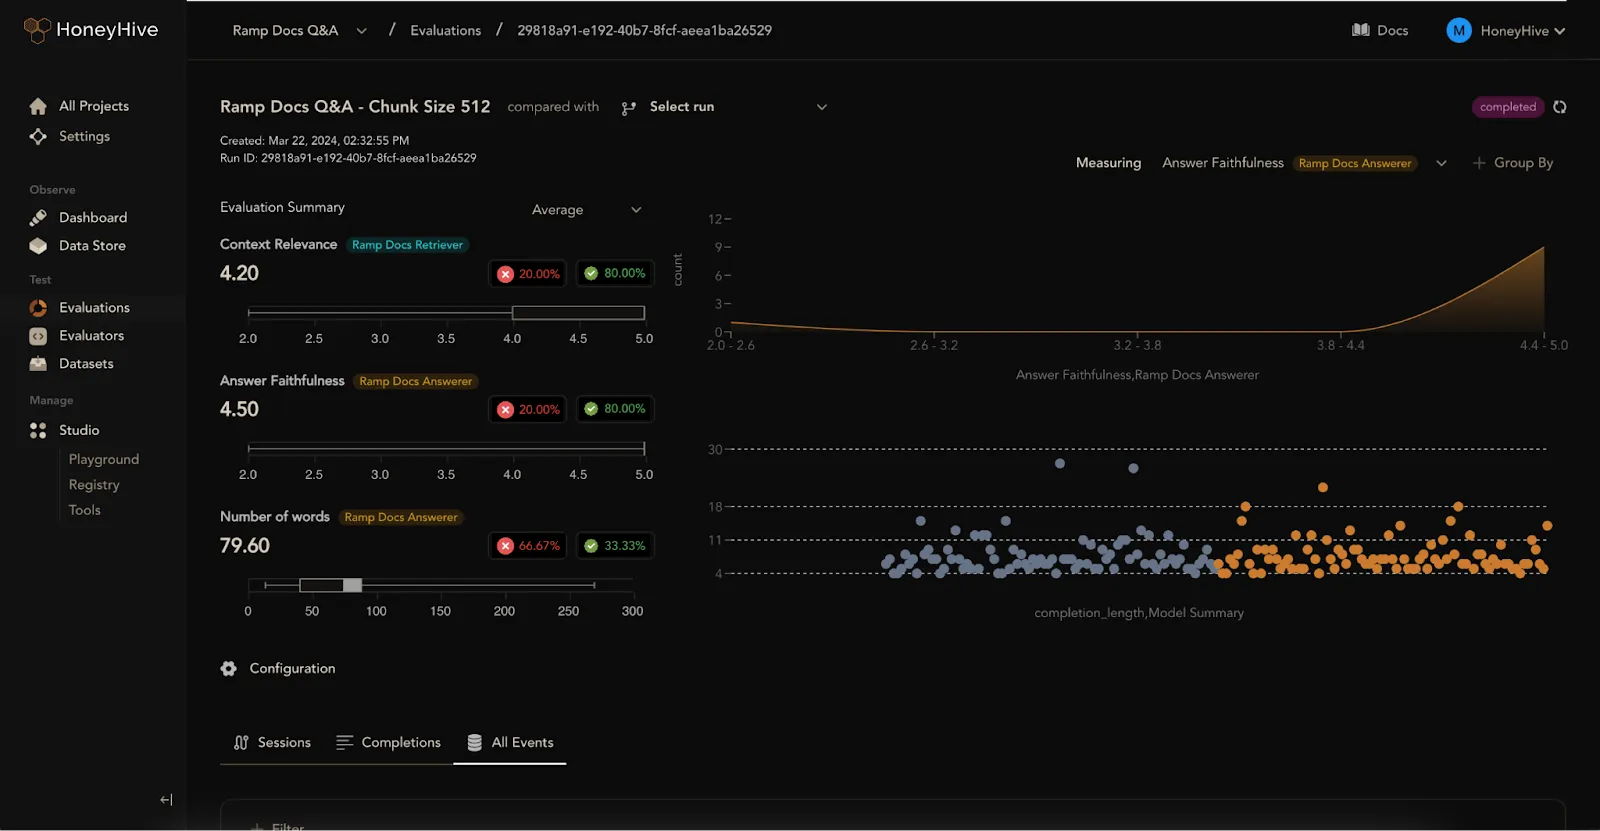
[HoneyHive](https://www.honeyhive.ai/) is an AI observability and evaluation platform designed to help teams monitor, debug, and optimize LLM\-powered applications in production. It offers robust tracing, performance analytics, and both human and automated evaluation tools, making it easier to understand how AI systems behave in real-world scenarios.
The platform gives users insight into model inference calls, external API interactions, and complex, multi-step agent workflows. It also captures user feedback and metadata, enabling comprehensive monitoring and continuous improvement across your AI stack.
With HoneyHive’s visual dashboards, teams can curate datasets, run online evaluations, and pinpoint issues with clarity and precision. The customizable interface allows teams to track user engagement, visualize performance metrics, and conduct cost analysis to stay within budget while maintaining quality.
One of HoneyHive’s strengths is its emphasis on human-in-the-loop evaluation and user-centric feedback, making it a great fit for teams focused on iterative improvement and customer experience. However, it may fall short in areas like advanced model evaluation and drift detection, making it a better supplementary tool for larger organizations rather than a standalone solution.
HoneyHive offers a free plan that supports up to 10,000 events per month for up to five users, giving smaller teams an accessible starting point for improving their AI applications.
## Treat Prompts Like Code
Lilypad brings software development best practices to the world of LLMs. With full-function versioning, inline annotations, and a smooth path from prototype to production, you’ll never lose track of what changed, or why it matters.
Want to learn more about Lilypad? Check out our code samples on our [documentation site](/docs/lilypad) or on [GitHub](https://github.com/mirascope/lilypad). Lilypad offers first-class support for [Mirascope](https://github.com/mirascope/mirascope), our lightweight toolkit for building [LLM agents](/blog/llm-agents).
Top 7 Alternatives to Langfuse for LLM Observability
2025-06-25 · 11 min read · By William Bakst