Observability in LLM systems means seeing what’s really going on, whether it’s inside your app, in your prompts, or in the model’s replies. It’s more than just logging requests and responses: it’s how you catch and understand the weird and unpredictable things that non-deterministic large language models do.
That means tracking everything, like prompt formats, API calls, response times, token counts, and user feedback. You collect data, run tests, and keep improving how the system behaves.
But you still can’t see how LLMs work on the inside, since their weights and decision-making are hidden. So you rely on what you can see: outputs, metadata, and system logs.
A lot of tools call themselves “observability” platforms, **but they only cover the basics**, like inputs, outputs, token counts, latency, and error rates. That’s standard telemetry, not true observability. Such tools help you track costs and performance, but they don’t explain why the model behaved a certain way. It’s like watching the scoreboard without seeing the plays that led to the score.
The goal isn’t just to watch but to *understand*. Observability helps you debug, test, and fine-tune prompts. You can tweak things in real time, compare versions, and use data to make better changes that actually improve results.
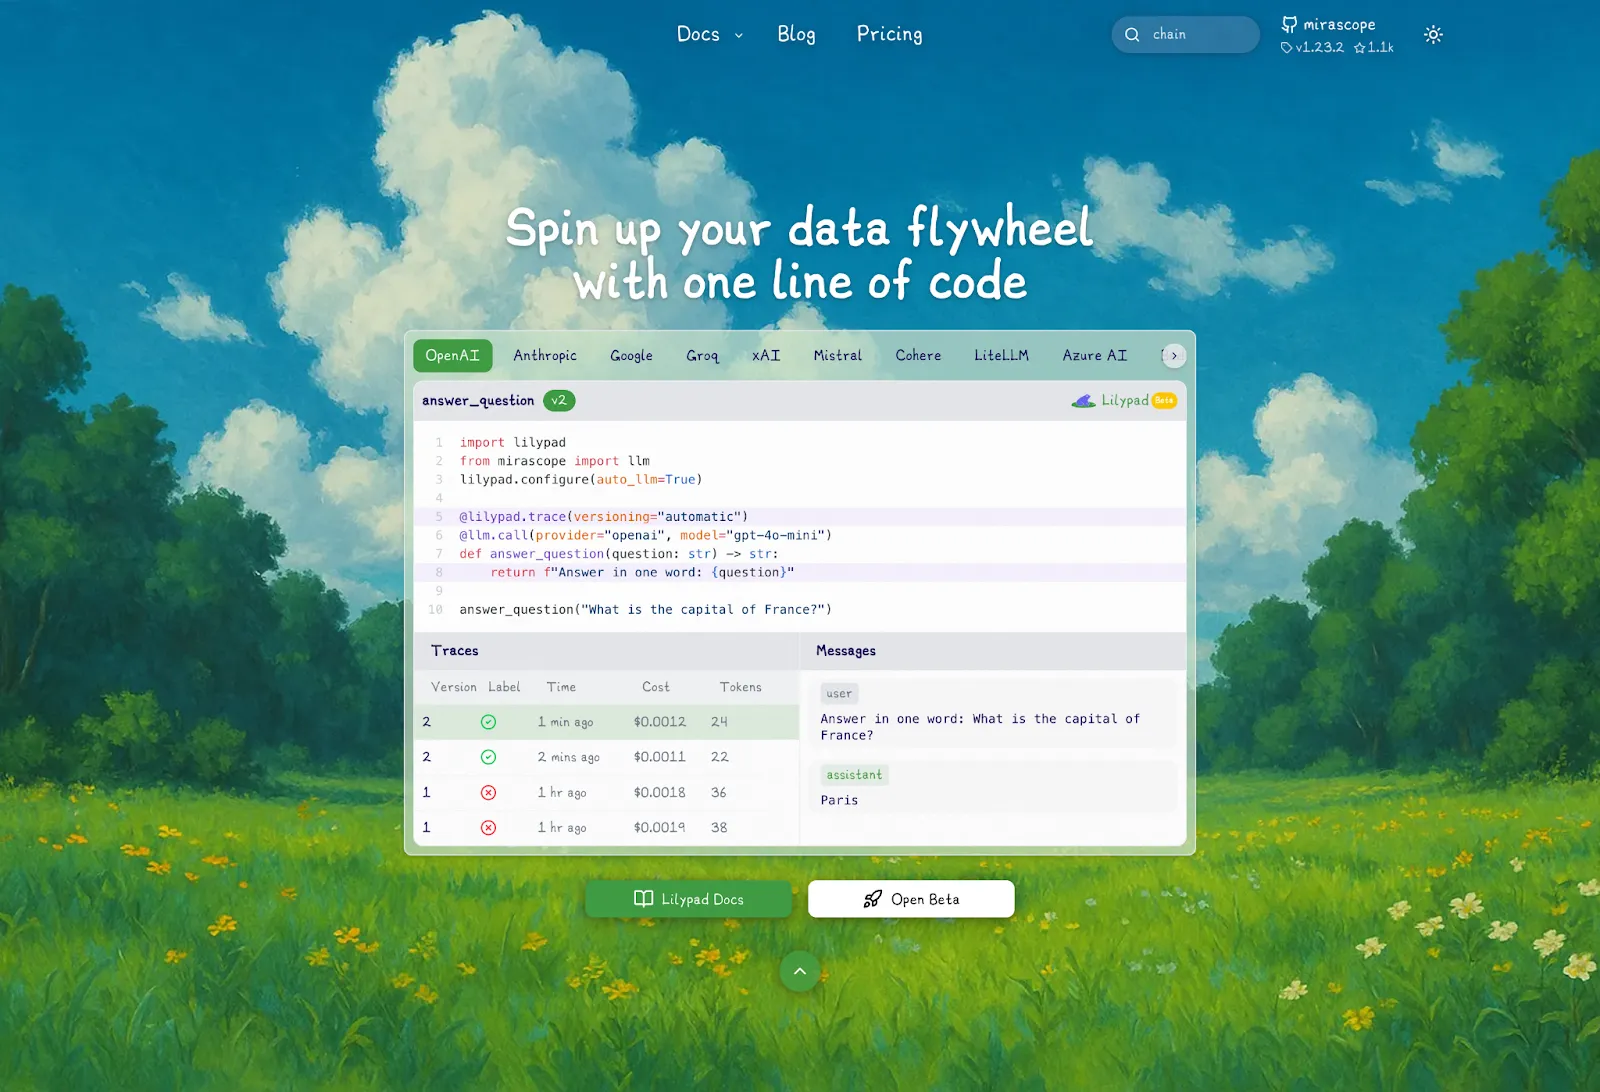
In this article, we’ll show you six tools that make this possible, starting with Lilypad, our open source framework for LLM observability. Lilypad treats every model call like an experiment, tracking what happened, versioning the call, and showing you what changed and why it matters.
Keep reading, or feel free to skip down to one of the observability tools below:
* [Lilypad](#1-lilypad-understanding-what-happened-and-why)
* [Langfuse](#2-langfuse-metrics-traces-and-model-insights-in-one-place)
* [Phoenix](#3-phoenix-visual-debugging-and-evaluation)
* [Helicone](#4-helicone-full-visibility-via-proxy)
* [Lunary](#5-lunary-analytics-that-drive-better-conversations)
* [Portkey](#6-portkey-monitoring-and-optimization-for-llm-apps)
## What to Look for in an LLM Observability Tool
A basic observability solution should help you:
* Spot outputs that sound right but are factually wrong (hallucinations).
* Check for bias or unfair responses, so your [LLM applications](/blog/llm-applications) stay ethical and balanced.
* Catch prompt injection and prompt hacking, which can mess with your system or leak data.
* Detect model drift, where the model’s behavior slowly changes over time for no clear reason.
That’s a start, but true observability offer deeper capabilities, like:
* End-to-end traceability, or full visibility into what happened, step by step (even for complex sequences like in [prompt chaining](/blog/prompt-chaining)). You should be able to see the inputs, outputs, nested calls, and internal logic that led to the final result.
* Reproducibility and versioning through snapshots of code, prompts, and even function closures, so you can go back, compare versions, and understand what changed and why.
* Human-in-the-loop evaluation, or tools that let you add notes, comments, and reasoning directly into traces, making it easier to review results and improve the model with human feedback.
We dive into tools offering these capabilities.
## 1. Lilypad: Understanding What Happened, and Why
[Lilypad](/docs/lilypad) is an open-source tool built for observing non-deterministic [LLM agents](/blog/llm-agents), where the same prompt doesn’t always give the same result. It’s designed to help you understand why something happened, not just what happened.
Unlike tools that only capture inputs and outputs, Lilypad traces each generation back to the exact version of the code that produced it. This means you get the full picture: inputs, logic, prompt transformations, model settings, and results, all tied to a specific function and version.
Because it works at the code level, you don’t need to rely on fragile manual versioning or be locked into writing prompts in a UI. You can work in plain Python, and Lilypad handles the observability and versioning for you, making [LLM integration](/blog/llm-integration) easier.
It also supports any model provider or framework, and you can [self-host it for full control](/docs/lilypad).
### Seeing the Whole Picture: How Lilypad Traces Execution Context
LLM outputs are influenced by everything that goes into them, like helper functions, temperature settings, and control logic. If you're only looking at the raw prompt text, you're missing half the story. That’s why tools that version just the prompt fall short.
For starters, you can add the line `lilypad.configure(auto_llm=True)` to automatically track every LLM API call made anywhere in your code using the [OpenTelemetry Gen AI spec](https://opentelemetry.io/).
This ensures spans are generated for each API call and that data like cost, token usage, and latency are captured.
But to trace the *why* and *how* (not just the *what*) we recommend wrapping your LLM calls in Python functions and decorating them with `@lilypad.trace(versioning="automatic")`. This captures the full execution context: inputs, model configuration, helper logic, and prompt transformations. Every run then becomes a reproducible, versioned snapshot of your code in action.
```python
from openai import OpenAI
import lilypad
lilypad.configure(auto_llm=True) # [!code highlight]
client = OpenAI()
@lilypad.trace(versioning="automatic") # [!code highlight]
def answer_question(question: str) -> str:
resp = client.chat.completions.create(
model="gpt-4o",
messages=[{"role": "user", "content": f"Answer this question: {question}"}],
)
return resp.choices[0].message.content
answer = answer_question("Who wrote 'To Kill a Mockingbird'?") # automatically versioned
print(answer)
# > Harper Lee wrote 'To Kill a Mockingbird'.
```
This also ties each trace directly to the exact code that produced it so you can always see what code ran, what inputs it used, and what output it returned.
Other [LLM tools](/blog/llm-tools) make you manage versions by hand, like tagging each prompt and updating the tag when things change, but that can be hard to administrate. To avoid this, most tools give you a special UI for writing prompts, but then you lose the power and flexibility of real code.
Lilypad works with your actual code and automatically tracks changes at the function level, so it can handle any kind of logic, not just prompts or LLM calls.
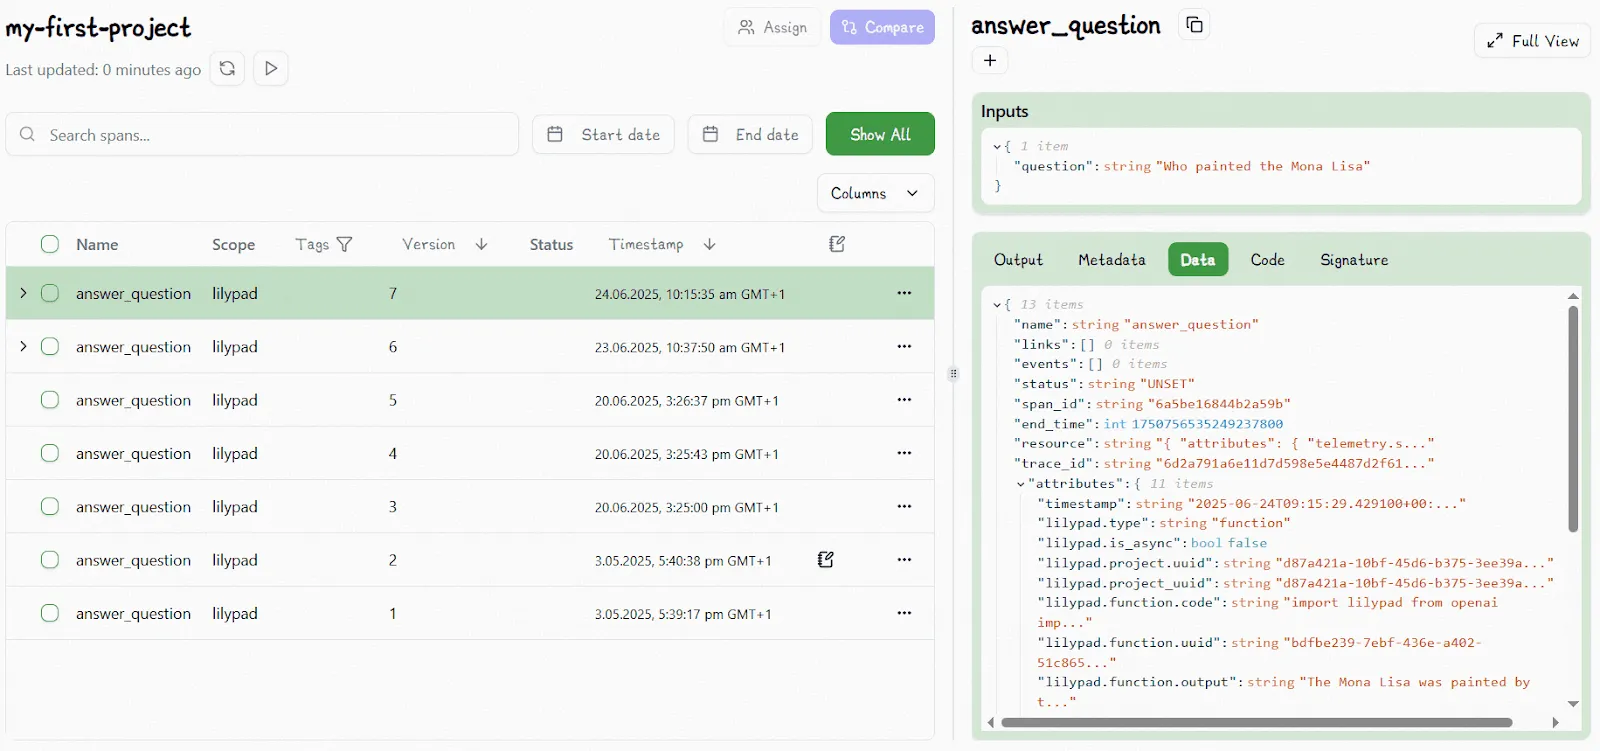
Once you’ve added the lines of code mentioned above, you can view the changes in the Lilypad UI , which automatically increments the version number for any change (e.g., changing the temperature or the prompt itself) you make within the function’s closure:
It even logs and tracks changes to user-defined functions or classes outside the main prompt function (as long as they’re within scope).
All this makes it easy to compare different runs and roll back to any version you need. You can always reproduce the exact state that led to a specific model response, and you’ll know what changed and why.
While other tools might offer the user experience of logging the prompt and maybe the input and output, Lilypad goes further by treating your whole function as the thing to track. That’s because in real-world code, LLM behavior depends on more than just the prompt, which itself is often shaped by the surrounding logic, pre-processing, and other code-level customizations.
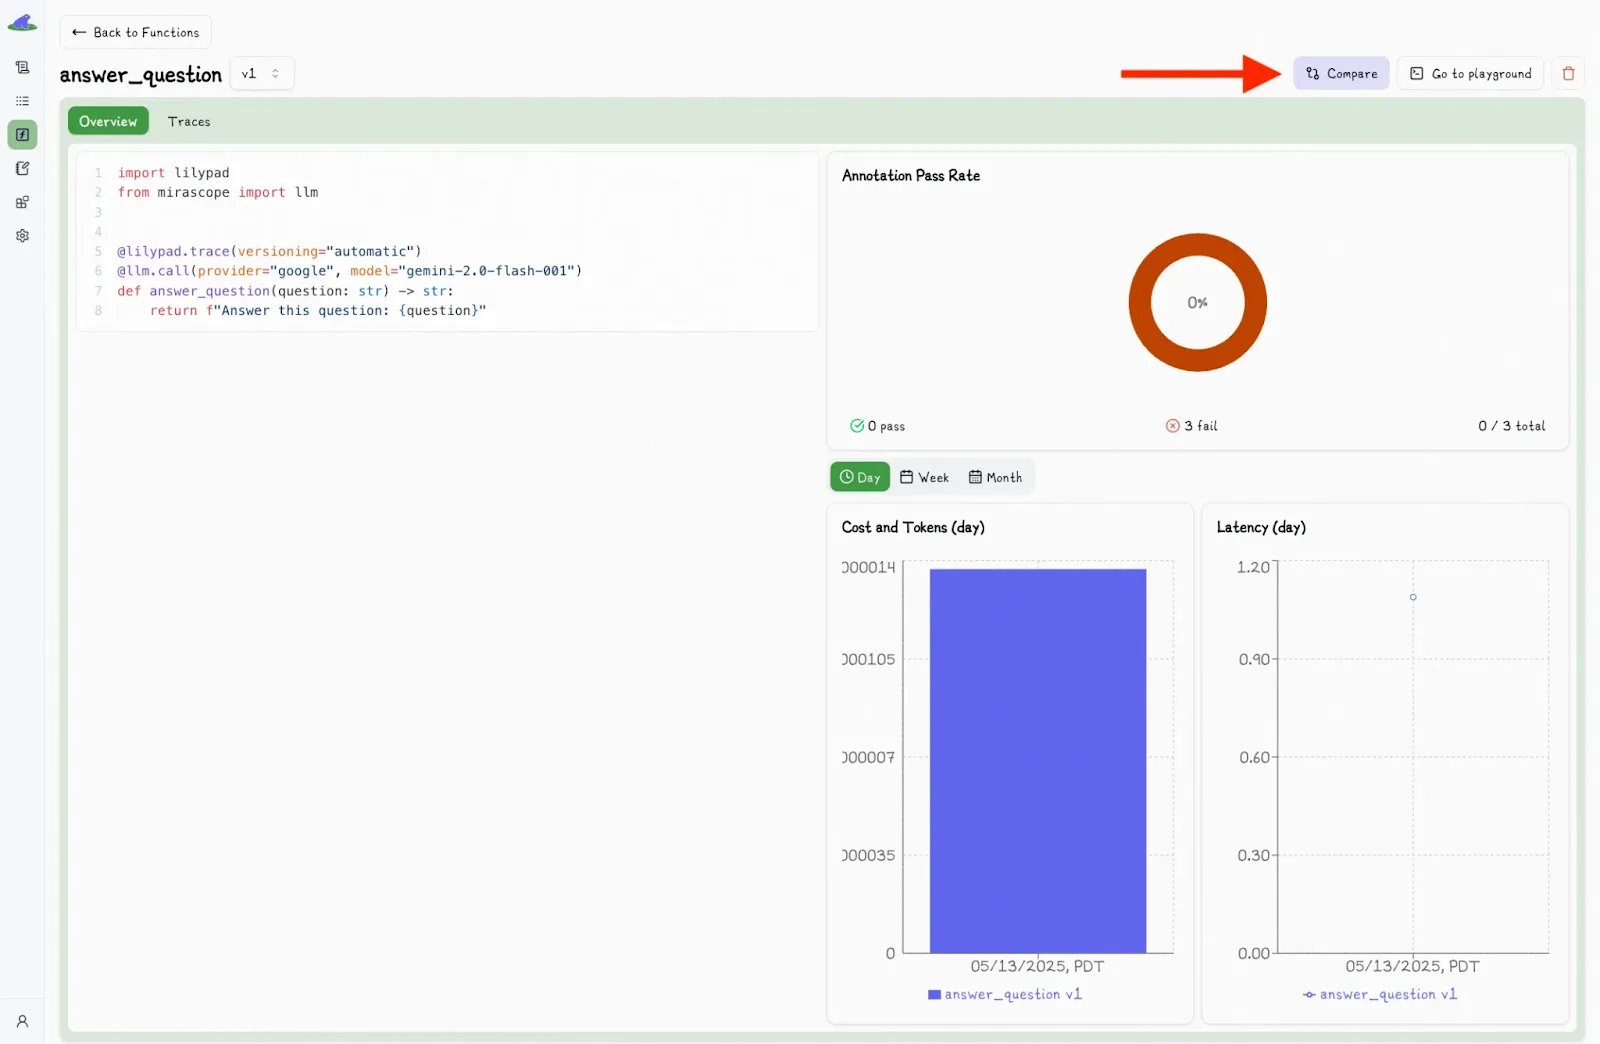
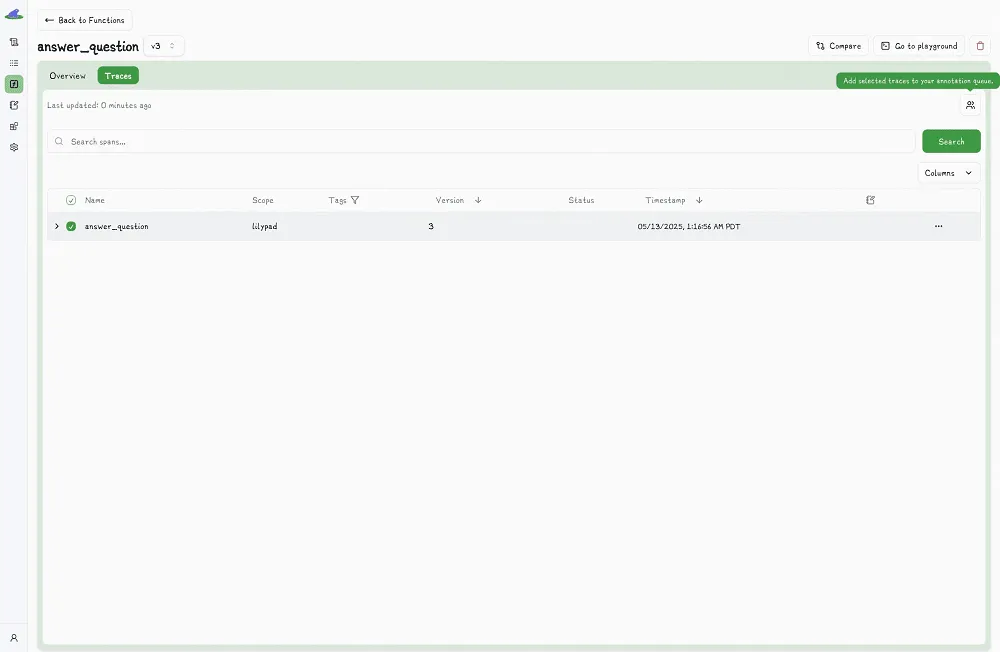
In the playground, the “Compare” button allows you to compare different versions of the code:
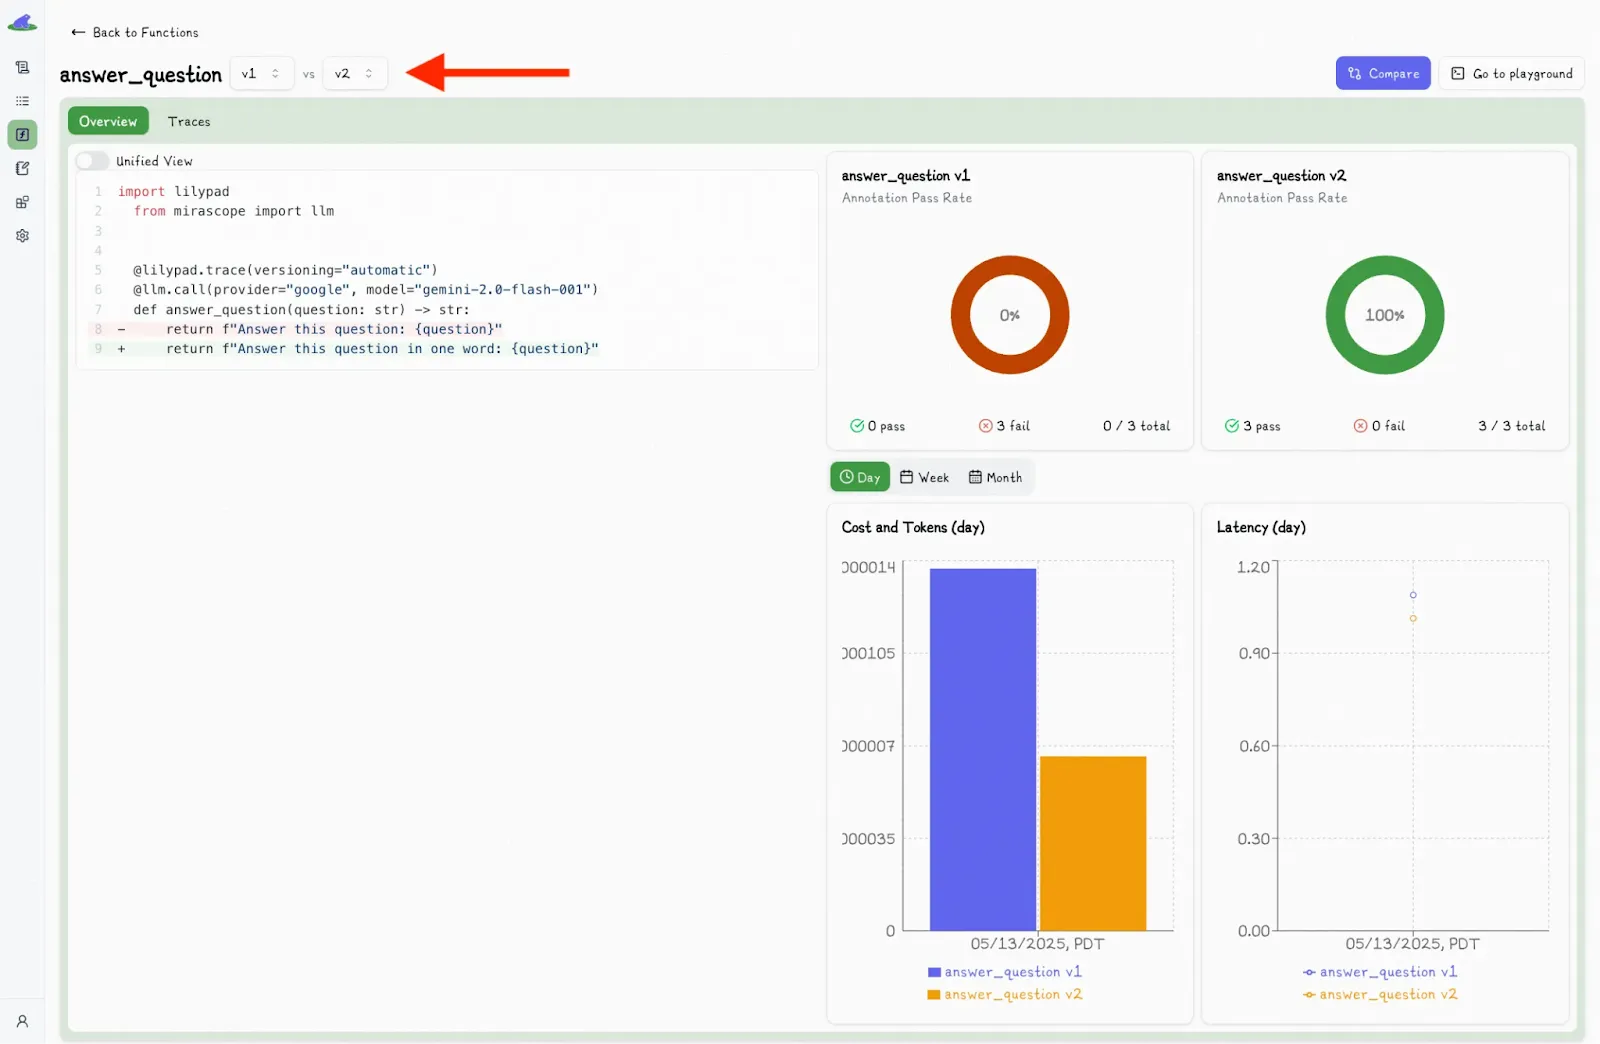
This shows a second dropdown menu, where you can select another version and view the differences side-by-side:
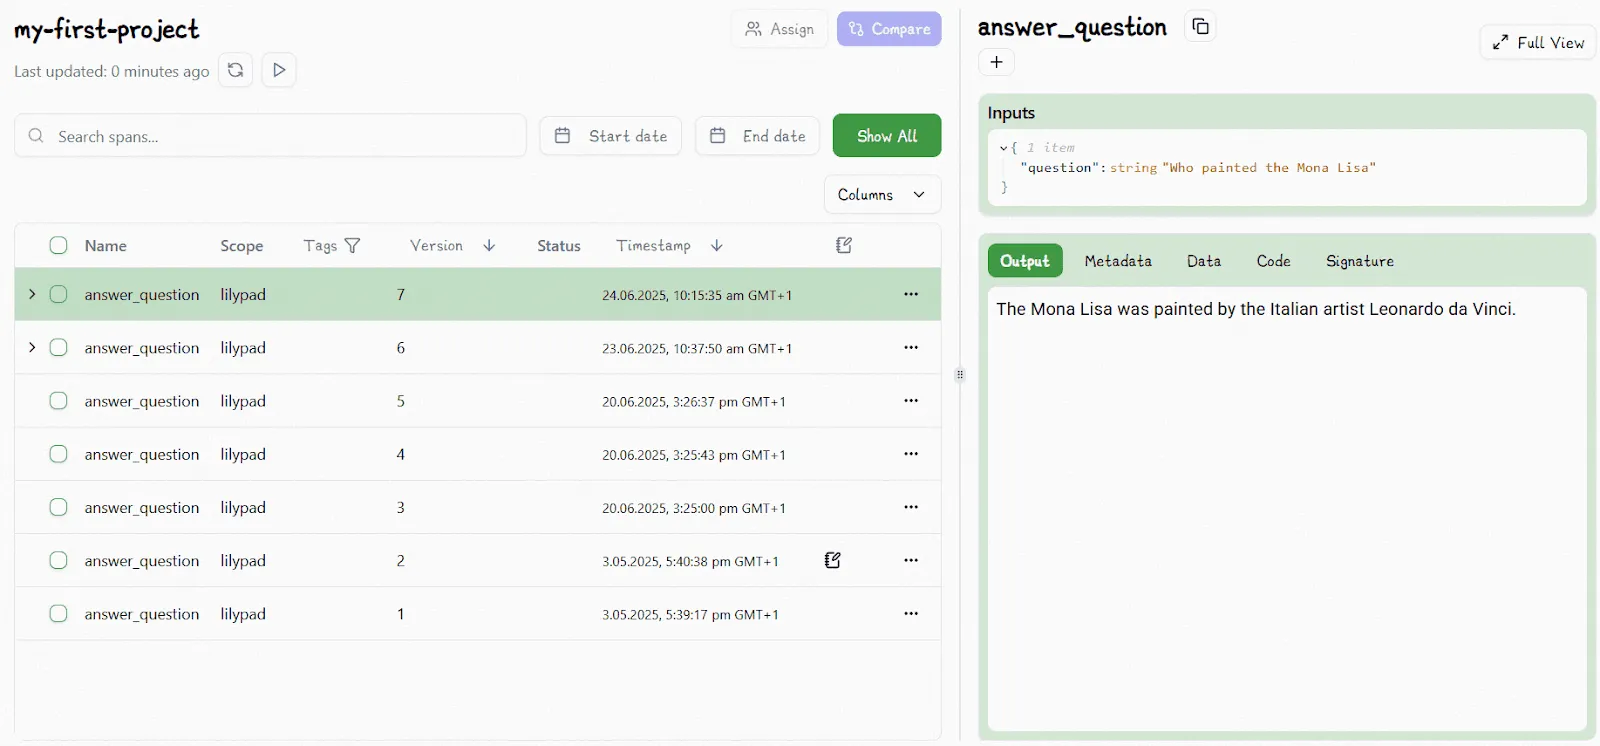
You can inspect trace data for any LLM call that’s wrapped in a function by selecting that function. This lets you see the full picture of what happened during the call, including inputs, logic, prompt changes, and model settings:
The `.version` method lets you access specific versions downstream and re-run their exact code to compare outputs, track changes, or reproduce earlier results.
For example:
```python
response = answer_question.version(6)("Who wrote 'To Kill a Mockingbird?'")
```
You can also use `.version` to run different versions of the same function, e.g., for A/B testing. Just send each version to a different subset of users and see which one performs better.
### A Visual Interface for LLM Observability
Lilypad offers a visual, interactive interface that brings together traces, versioning, and annotations all in one place, allowing non-technical users to collaborate. This no-code environment is designed for domain experts who want to improve how LLMs behave and test different prompt wordings, tweak parameters, and observe how the model responds, all without needing to touch the underlying code or ask engineers for help.
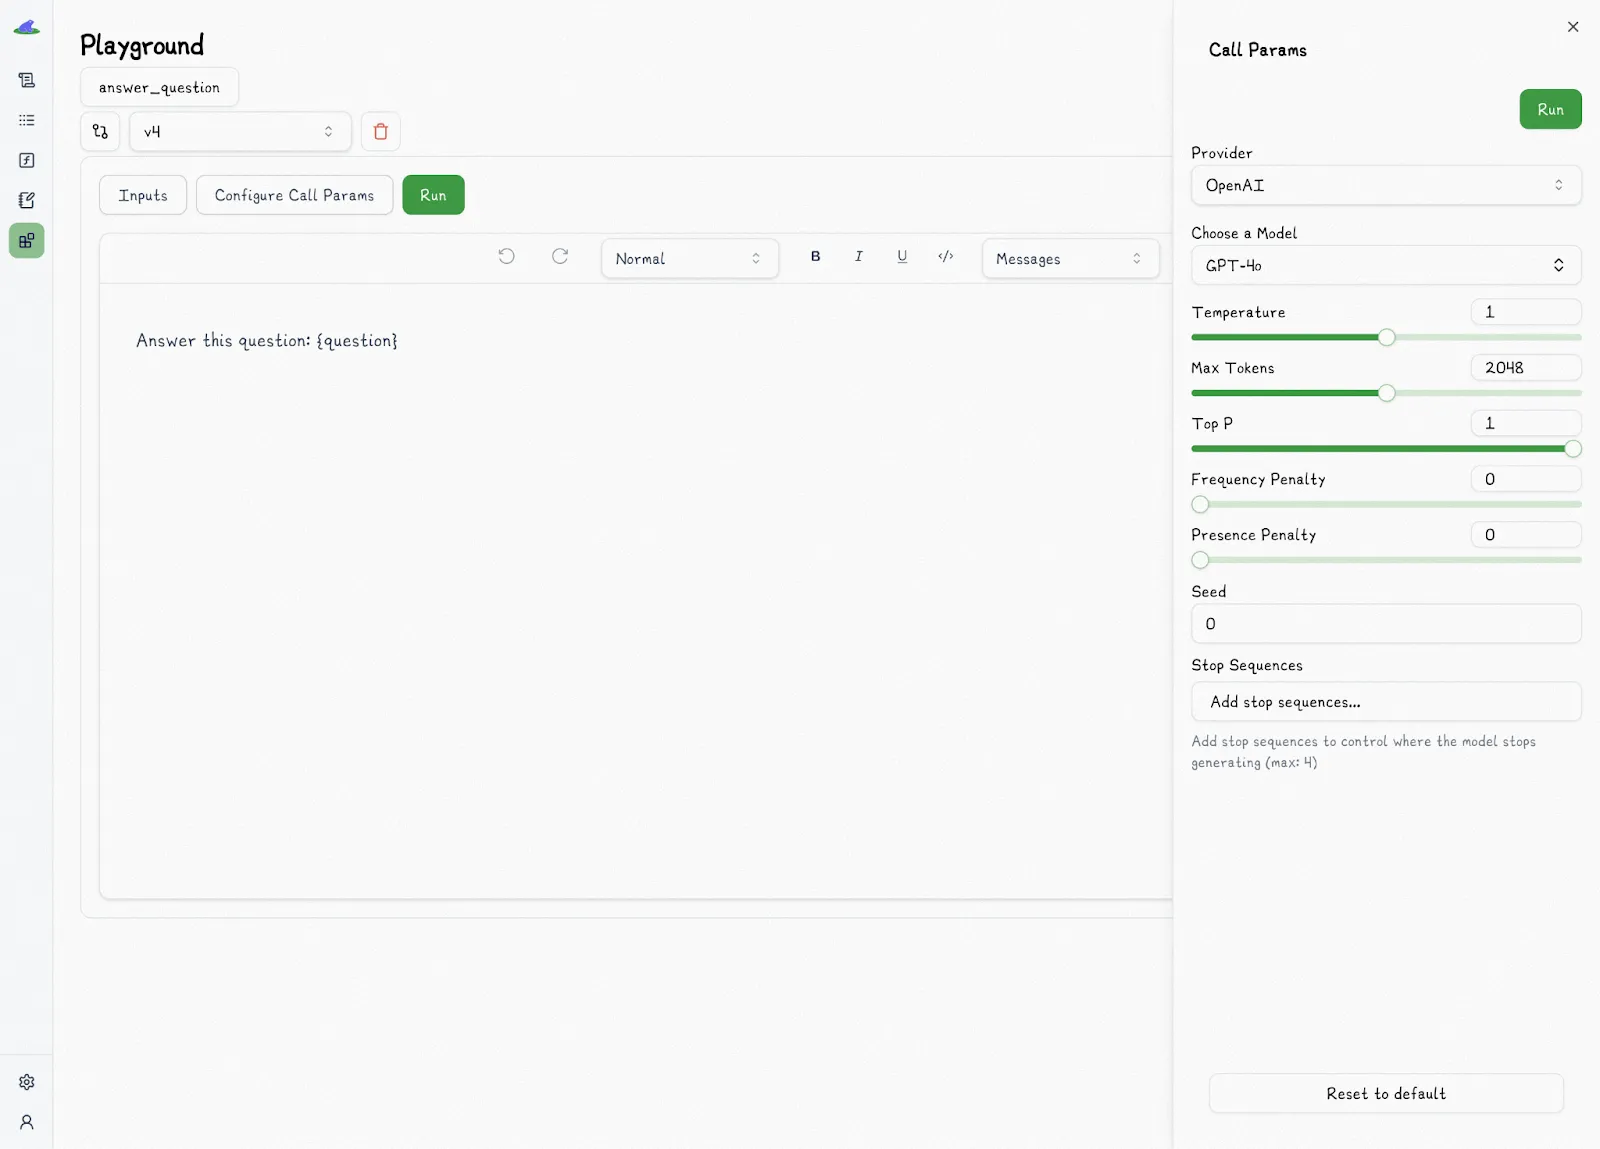
The Lilypad playground allows users to write prompts in markdown with typed variable placeholders. When someone edits a prompt, like changing the wording or adjusting a setting, Lilypad automatically creates a new version of the Python function behind the scenes. This has the same effect as editing and rerunning the function directly in code.
The playground also shows the actual Python functions (that are decorated with `@lilypad.trace()`), so SMEs can directly interact with the prompts those functions use. The code you see in the playground is the same code that runs downstream since they mirror each other. So even if Lilypad ever goes down, **the code will still run as expected**.
Every prompt template is tied to a function signature, ensuring strong typing and reproducibility for any use case around evaluation, debugging, or deployment. The inputs are type-checked, which helps prevent bugs like missing values, wrong formats, or injection risks.
Lilypad’s playground also visualizes the full trace of each run, including inputs, outputs, provider and model info, along with settings like temperature and metadata like token usage, latency, and cost. The playground captures a complete snapshot of the execution so users can see what happened and why.
### Turning Outputs into Feedback Loops
[LLM evaluation](/blog/llm-evaluation) isn’t just about checking if an answer is right or wrong; it’s about understanding whether the response was *good enough* for the situation. In many cases, there’s no clear correct answer, so human judgment becomes an all-important part of the process. Observability, in this context, isn't just about catching failures: it’s about recognizing what made a response succeed or fall short.
Lilypad makes this possible by treating annotations as a key part of its observability system. An annotation is tied directly to a single span, which means it’s connected to the exact function version, inputs, prompt, and model settings that produced the output. This grounds feedback in its full context.
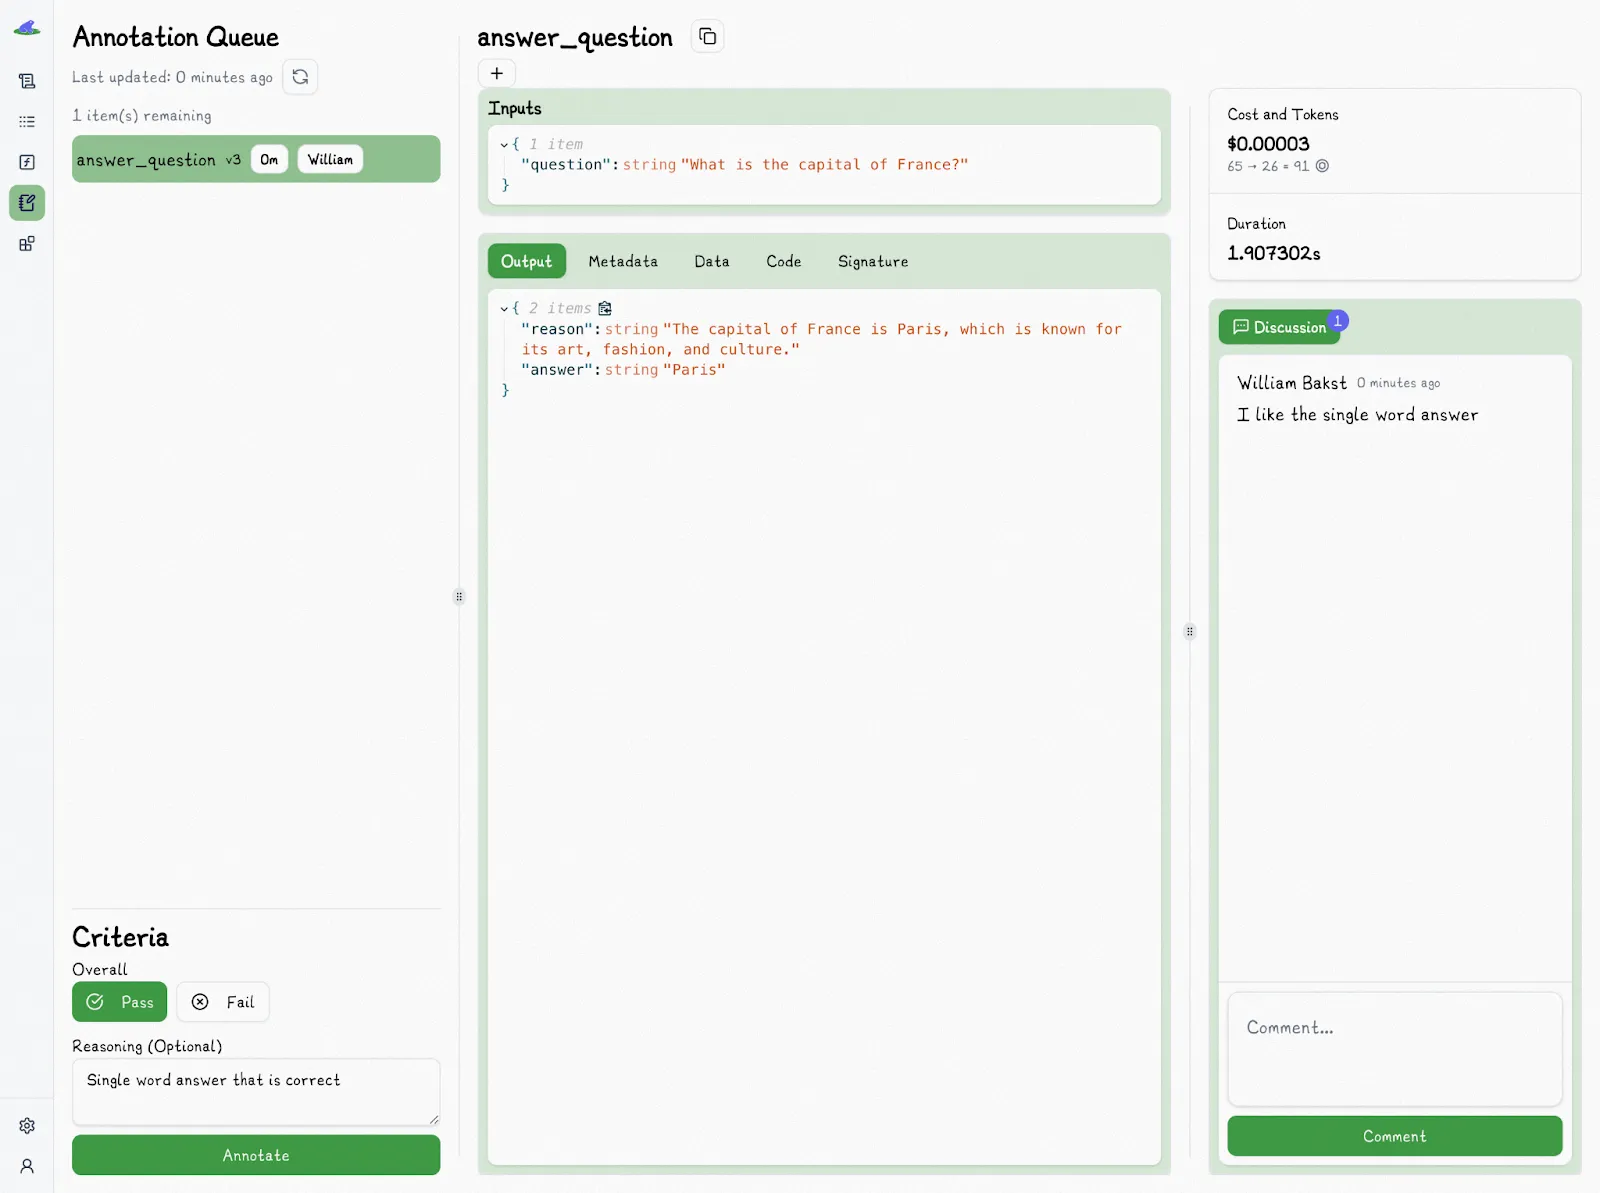
You can assign reviewers to specific outputs and organize them into [prompt evaluation](/blog/prompt-evaluation) queues. Human reviewers define what “good enough” really means, and label outputs as pass or fail, adding optional notes to explain their reasoning. This turns gut checks into structured, searchable data.
These annotations are saved alongside traces and function versions, creating a feedback trail that’s easy to review and reproduce. To keep reviews unbiased, Lilypad hides existing annotations when someone is evaluating a trace.
Developers can also add annotations directly in code, right after a function runs. By setting `mode="wrap"` in the `@lilypad.trace` decorator, the function’s return value becomes a special object that still includes the output, but also lets you add annotations with `.annotate()`.
This is useful for automated testing, scripted evals, or CI/CD workflows, where you want to capture evaluations without switching to the playground.
```python
from google.genai import Client
import lilypad
client = Client()
lilypad.configure()
@lilypad.trace(name="Answer Question", versioning="automatic", mode="wrap") # [!code highlight]
def answer_question(question: str) -> str | None:
response = client.models.generate_content(
model="gemini-2.0-flash-001",
contents=f"Answer this question: {question}",
)
return response.text
trace: lilypad.Trace[str | None] = answer_question("Who wrote 'To Kill a Mockingbird'?")
print(trace.response) # original response
# > Harper Lee wrote 'To Kill a Mockingbird'.
annotation = lilypad.Annotation( # [!code highlight]
label="pass", # [!code highlight]
reasoning="The answer was correct", # [!code highlight]
data=None, # [!code highlight]
type=None, # [!code highlight]
) # [!code highlight]
trace.annotate(annotation) # [!code highlight]
```
Manual reviews are just the beginning. As you collect more annotations, you can train an LLM to act as a judge, automatically labeling new outputs based on past examples. This shifts your team’s job from doing all the labeling to just verifying the results, which saves time while keeping humans in the loop for accuracy.
Each labeled example helps build a stronger dataset for comparing different versions and catching performance regressions. This turns model outputs into measurable progress over time. That said, it’s still important to manually spot-check evaluations to ensure the model isn’t quietly getting things wrong in ways that automated [LLM-as-a-judge](/blog/llm-as-judge) checks might miss.
You can [sign up for Lilypad](https://lilypad.mirascope.com/) using your GitHub account and get started with tracing and versioning your LLM calls with only a few lines of code.
## 2. Langfuse: Metrics, Traces, and Model Insights in One Place
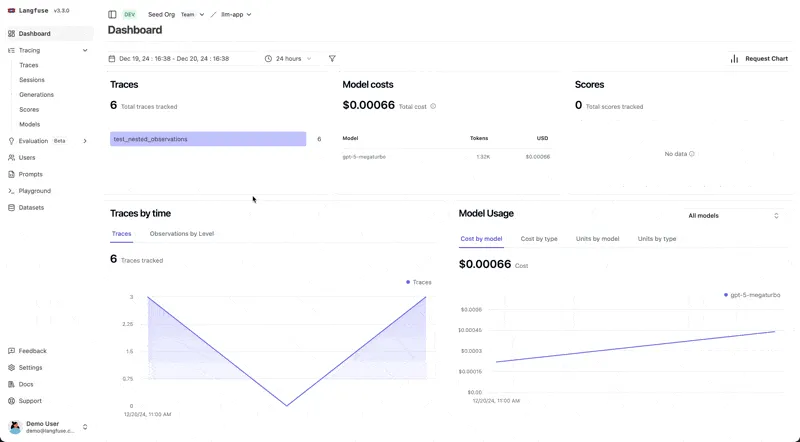
[Langfuse](https://langfuse.com/) is an open-source platform that gives you LLM monitoring, debugging, and analytics for your LLM applications. It tracks the entire flow of how your app runs, from API calls and prompts to retrieval steps and agent actions, so you can clearly see how your LLM workflows behave and where things might be going wrong.
### Langfuse Key Features
* Enables granular tracing of all LLM-related components, including support for multi-modal data like text, audio, and images.
* Monitors LLM performance and key metrics like cost and latency at detailed levels, helping teams manage performance and backend resource usage across models, prompts, and users.
* Integrates user feedback and supports both manual and automated output evaluation to improve model quality continuously.
* Provides prompt versioning and testing tools, making it easier to iterate quickly and link prompt changes to observed outcomes.
* Offers dataset tools for benchmarking and testing using real production traces, enabling reliable experimentation and validation.
* Works with any model or framework, supports multiple SDKs, and integrates with tools like OpenAI, LangChain, and LlamaIndex.
## 3. Phoenix: Visual Debugging and Evaluation
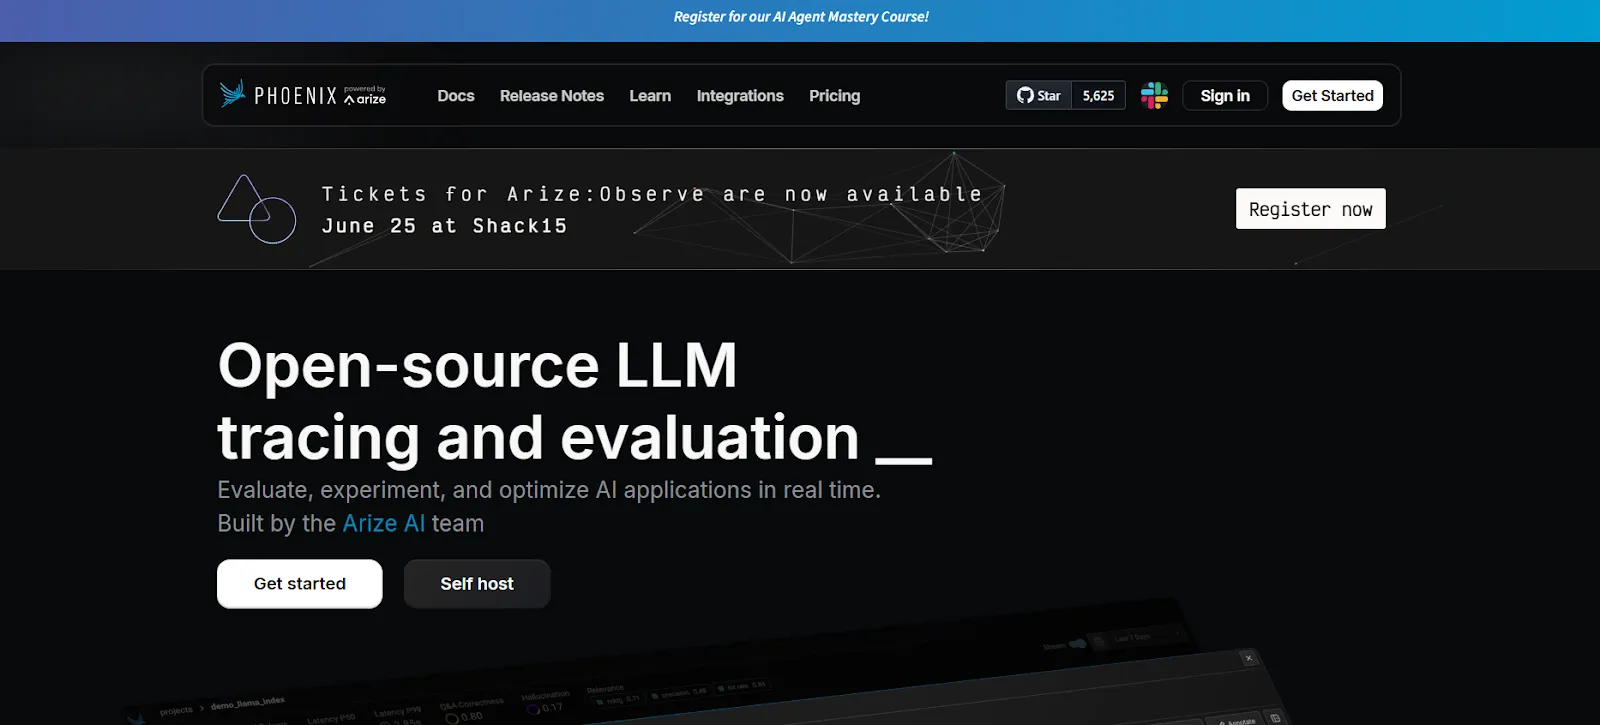
[Phoenix](https://phoenix.arize.com/), built by Arize AI, shows how your LLM applications are behaving and performing, and acts as a central hub where you can trace, evaluate, and debug your LLM workflow.
### Phoenix Key Features
* Captures detailed traces of LLM executions, including inputs, outputs, intermediate steps, and latency metrics.
* Visualizes hierarchical workflows to identify bottlenecks and failures across chains and agent steps.
* Supports multiple evaluation metrics and types: LLM-based, code-based, and human-in-the-loop, for assessing relevance, safety, and accuracy.
* Enables benchmarking against datasets to detect hallucinations, biases, and regressions.
* Offers replay functionality to test the impact of changes (e.g., prompt edits) on outputs.
* Integrates with OpenTelemetry and OpenInference to support diverse stack and deployment environments.
## 4. Helicone: Full Visibility via Proxy
[Helicone](https://www.helicone.ai/) is a proxy-based tool that sits between your app and the LLM provider, capturing data from every request and response. You don’t need to change much in your code; it works by simply switching the API base URL. This makes it easy to set up and fast to use, especially for teams who want quick observability without a lot of extra work.
### Helicone Key Features
* Logs and traces interaction histories, including multi-step agent workflows, to help debug and optimize behavior across user journeys.
* Provides centralized visibility into latency, token usage, and costs, supporting both real-time and historical analysis.
* Supports multiple LLM providers (OpenAI, Azure, Anthropic, Gemini, Cohere).
* Includes gateway features like provider routing, model failover, and rate limiting to improve reliability and control.
* Offers both cloud and self-hosted deployment options, with scalable performance and minimal added latency.
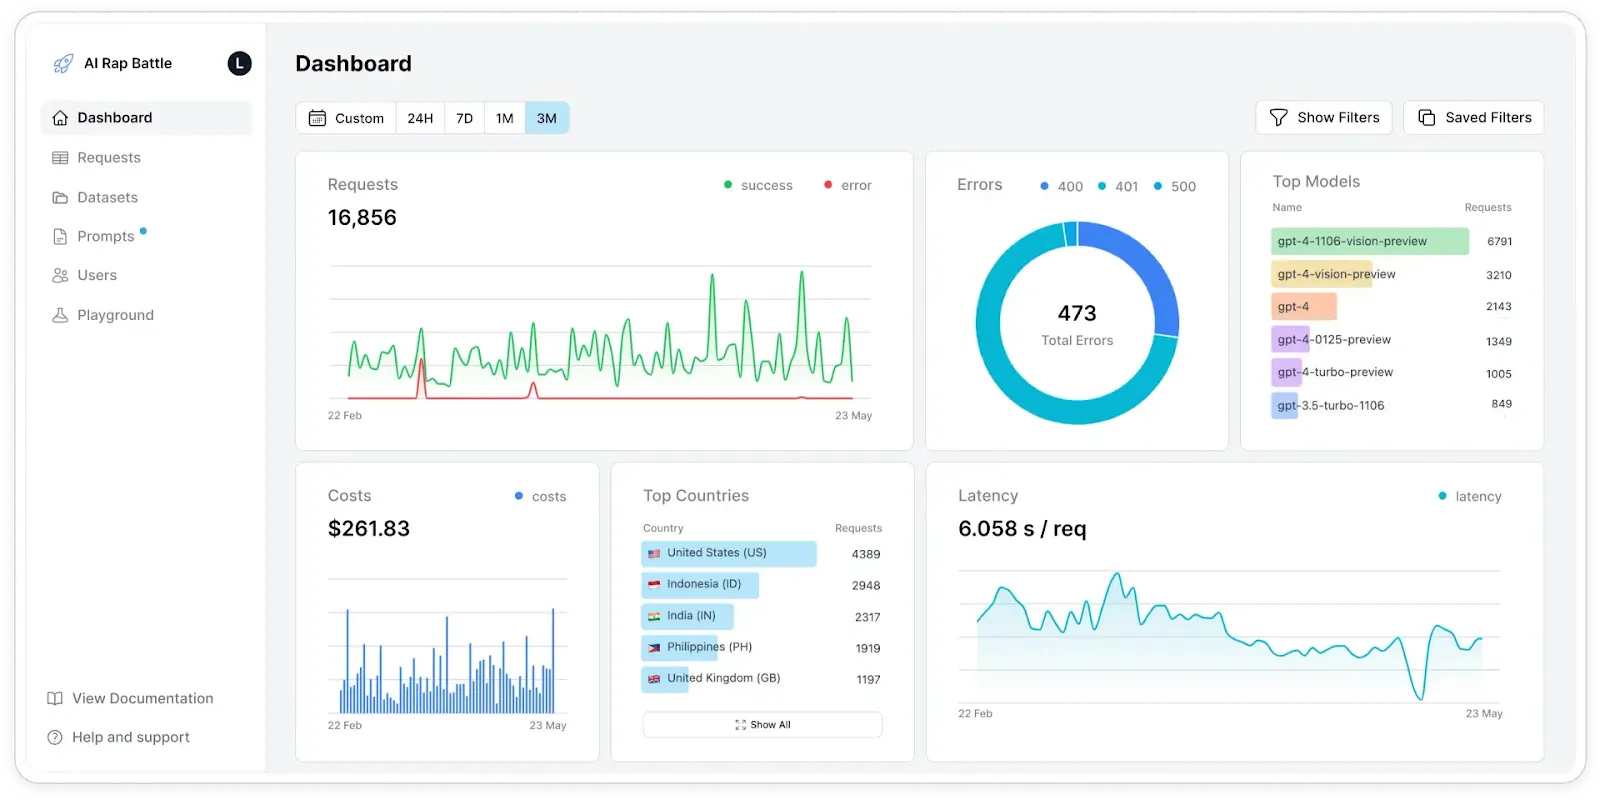
## 5. Lunary: Analytics That Drive Better Conversations
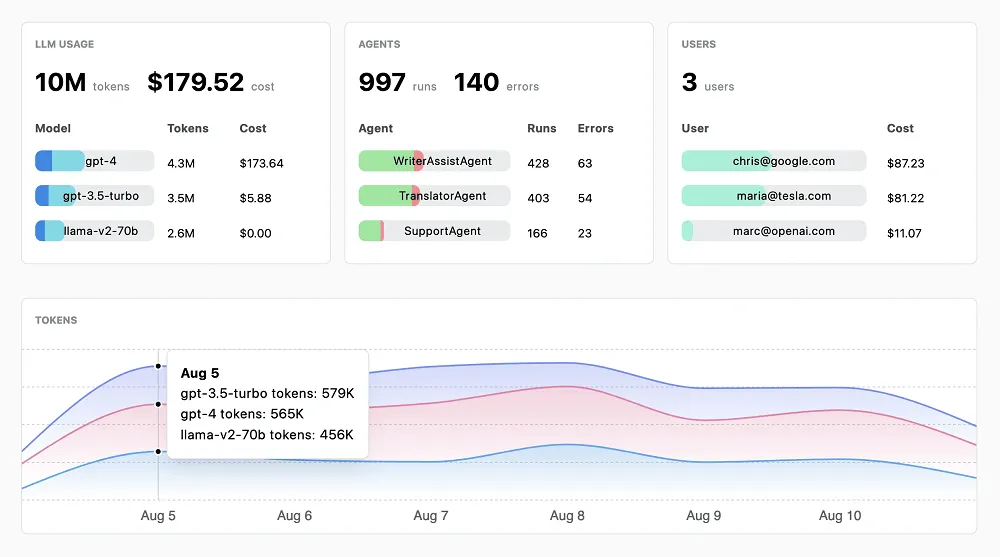
[Lunary](https://lunary.ai/) is an open-source platform that gives you visibility into how your LLM-powered apps are working, from chatbots to agent workflows. It's designed to be model-agnostic, meaning it works with any LLM provider. Lunary helps you monitor performance, understand what’s going on under the hood, and debug problems at a production level.
### Lunary Key Features
* Captures full traces of every LLM call, including prompts, LLM responses, and errors, to support detailed debugging and analysis.
* Logs usage metrics like latency, token counts, cost, and user activity for ongoing performance monitoring and trend analysis.
* Enables versioned prompt management, collaboration, and A/B testing to improve prompt design across technical and non-technical teams.
* Supports human-in-the-loop review and automated scoring of outputs, helping teams evaluate response quality and gather training data.
* Provides classification tools (e.g., topic and sentiment analysis) to extract trends and increase interpretability of conversation logs.
* Offers customizable dashboards and alerting for stakeholders, surfacing anomalies, failures, and usage patterns in real time.
## 6. Portkey: Monitoring and Optimization for LLM Apps
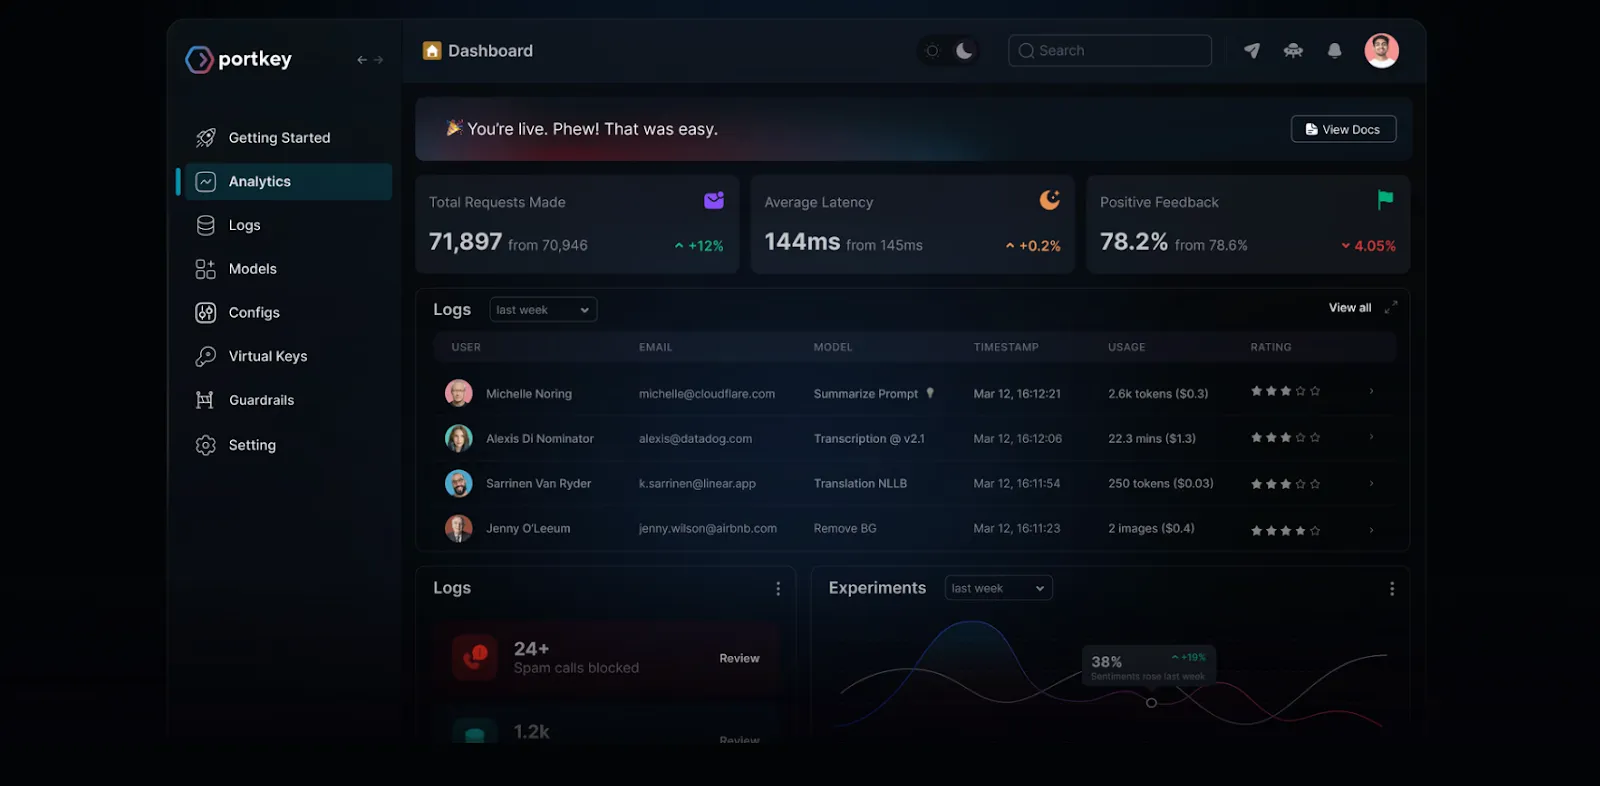
[Portkey](https://portkey.ai/) is an observability platform that helps teams work with large language models, acting as a gateway to give you a single API to connect with many different AI models, no matter the provider. With Portkey, teams can build, monitor, and improve their LLM-powered apps efficiently and without having to manage each model separately.
### Portkey Key Features
* Captures requests and responses with many different performance metrics (e.g., cost, latency, accuracy).
* Real-time dashboards and analytics expose system health, token usage, error rates, and performance inefficiencies.
* Centralized logging of inputs, outputs, and errors supports debugging and root cause analysis.
* OpenTelemetry-compliant tracing follows each request through the full LLM stack to isolate bottlenecks and failures.
* Tracks prompt performance and usage trends to optimize prompt engineering in production.
## See Beyond the Output
Real observability means more than watching what your model says; it means understanding why it said it. With Lilypad, every generation in your [LLM pipeline](/blog/llm-pipeline) is traced, versioned, and open to inspection, turning it into a data point you can learn from.
Want to learn more about Lilypad? Check out our code samples in our [docs](/docs/lilypad) or on [GitHub](https://github.com/mirascope/lilypad). Lilypad offers first-class support for [Mirascope](/docs/mirascope), our lightweight toolkit for building LLM agents.
Top 6 Open Source LLM Observability Tools
2025-07-23 · 10 min read · By William Bakst