LLM monitoring refers to watching how your model behaves when it's actually being used in production. Not just whether requests are completing and how long they take, but whether it's still giving good answers, staying on-topic, and behaving the way you expect, even as the surrounding code, prompts, or models change.
Monitoring sits on top of observability, which gives you raw visibility into the system, things like logs, traces, metadata, inputs, outputs. Monitoring is how you *use* that visibility: tracking behavior, measuring performance, and setting up alerts when something drifts or breaks.
This matters even more with LLMs, where behavior is unpredictable by design and the same question can give different answers. **Without good monitoring, changes are hidden**, and you won’t know why outputs shifted, when quality dropped, or whether the model is still safe and reliable in real-world use.
So monitoring isn’t just a nice-to-have, but is essential for keeping LLMs reliable, safe, and effective in production. In this article, we’ll explore what good LLM monitoring looks like, why it matters, and how you can go beyond surface metrics to actually understand your system.
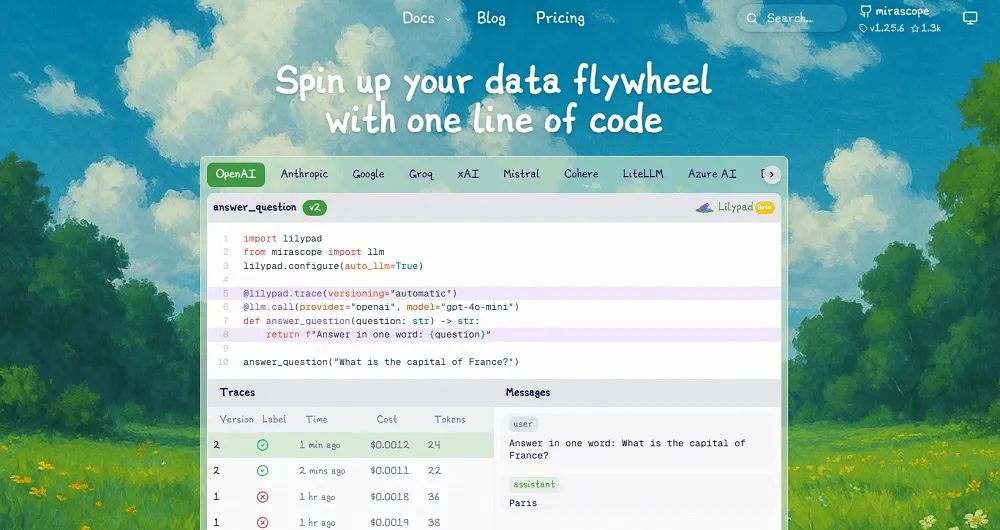
We’ll also explore some top open source options, starting with [Lilypad](/docs/lilypad), our prompt engineering framework. Lilypad automatically traces and versions the full code context around every LLM call so you don’t just see what happened, but know why the model behaved the way it did.
Below are our preferred open source options:
1. [Lilypad](#1-lilypad-captures-the-why-behind-llm-outputs)
2. [Langfuse](#2-langfuse-experimentation-feedback-and-benchmarking-for-llms)
3. [Phoenix (by Arize)](#3-phoenix-by-arize-a-monitoring-tool-designed-for-experimentation-and-debugging)
4. [Helicone](#4-helicone-a-monitoring-hub-for-performance-cost-and-accuracy)
5. [Opik](#5-opik-continuous-evaluation-and-real-time-llm-monitoring)
6. [Lunary](#6-lunary-a-full-stack-monitoring-toolkit-for-llms)
## What Metadata Can’t Tell You
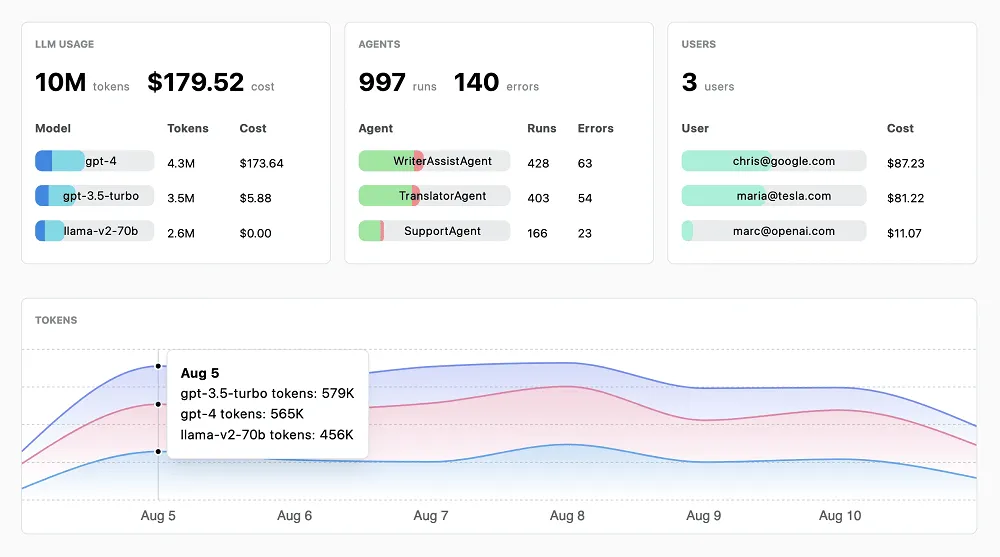
Most LLM monitoring platforms focus on just tracking metadata (things like cost, latency, token usage, and inference time). These metrics are useful, especially for keeping tabs on performance and infrastructure costs. They also originate from deterministic systems, where if everything’s running fast and cheap, you can often assume the system is working correctly. After all, the same input always gives you the same output.
When systems are predictable, tracking system-level metrics is usually enough to figure out what went wrong. But large language models aren’t predictable. They’re sensitive and non-deterministic, which means that if you want to actually understand their behavior, you have to go deeper. **Latency and token count tell you how the system performed, but not why a particular answer came out the way it did**.
To monitor and improve model performance, you need LLM-specific metrics that help you identify the root cause of unexpected behavior. That includes accuracy, correctness, and relevance of outputs, plus hallucination detection. You also need detailed traces of what the model did: what tools it called, which steps it followed in agent workflows, or how, for example, it pulled in data from vector databases (in a [RAG application](/blog/rag-application)).
Test results are also important. Which prompts, models, or techniques like [prompt chaining](/blog/prompt-chaining) performed best in systematic experiments? What were the trade-offs between speed, cost, and quality? What can you learn from real production data that can help you build better test sets for offline evaluations?
But even platforms that *do* support evaluating LLM responses often focus on the prompt alone, as if it were just a string that you version, tag, and test. The problem is, prompts don’t live in isolation. They’re embedded in real code, shaped by control flow, string construction, helper functions, parameters, and model settings, which all influence the final output. When something goes wrong, it’s not enough to know what prompt was used, but how it was used.
**That’s why effective LLM monitoring captures the entire context of the call**, because if you want to explain the root cause of a weird output, reproduce a bug, or compare two strategies side-by-side, you need to be able to rerun the exact version of the function that produced it; not just the prompt, but everything that shaped the call.
To help you monitor and improve large language models with the clarity needed, below are six [LLM observability](/blog/llm-observability) tools that are open source and that trace behavior, capture context, and support systematic evaluation.
## LLM Monitoring Tools That Are Open Source and Free
### 1. Lilypad: Captures the Why Behind LLM Outputs
[Lilypad](/docs/lilypad) is an open source framework built for tracking, debugging, and optimizing [LLM applications](/blog/llm-applications), letting developers run their LLM workflows with the same insight, traceability, and reliability they’re used to when working with traditional software.
Instead of treating prompt engineering like trial and error, Lilypad treats it as an optimization problem by capturing the full code context around every LLM call, versioning changes automatically, and providing tools to evaluate, compare, and improve outputs in a systematic, repeatable way.
Lilypad also captures surface-level metrics, like the latency of every span. For spans that involve LLM API calls, it logs the cost of the call and gives you visibility into token usage, making it easier to track performance over time.
#### Versioning LLM Calls with Full Context
To start tracking standard metadata about every LLM API call, like latency, cost, token usage, and inputs, you add the line `lilypad.configure(auto_llm=True)` to your code.
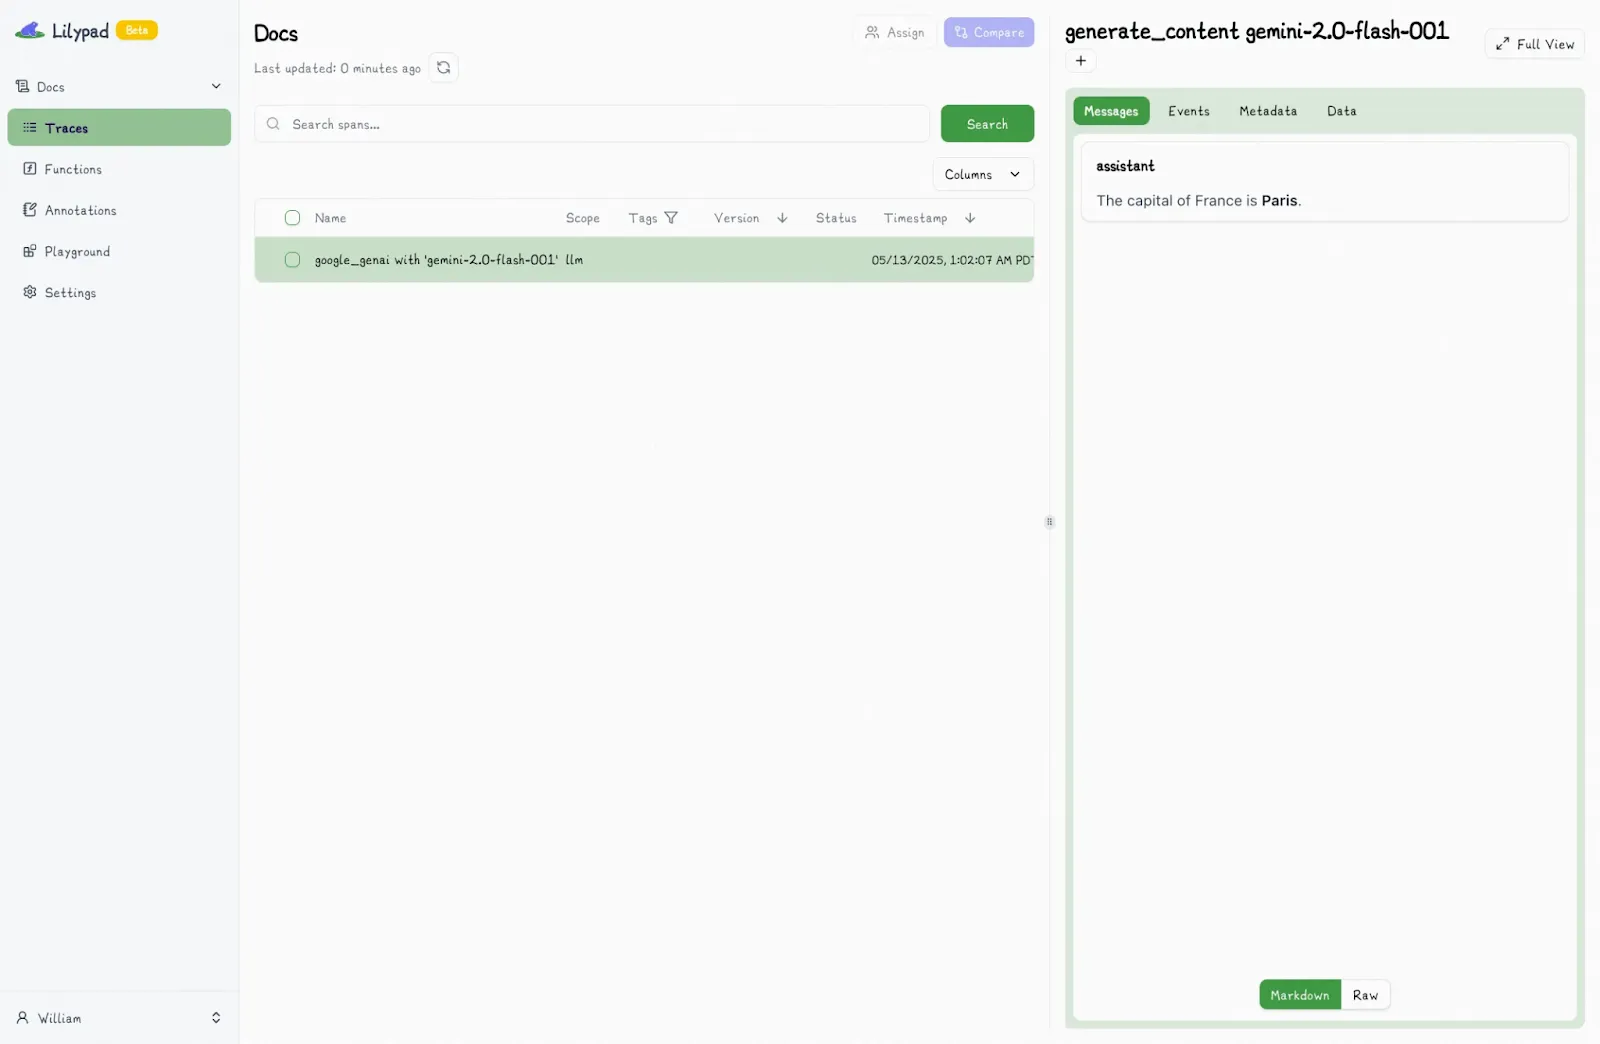
Lilypad uses the [OpenTelemetry Gen AI spec](https://opentelemetry.io/) to produce a full record of the model’s execution path. If your code is already instrumented with OpenTelemetry, it works with Lilypad automatically (no changes needed). So if you make a call to Google’s Gemini API, for instance, that call shows up in your Lilypad project as a detailed span.
```python
from google.genai import Client
import lilypad
lilypad.configure(auto_llm=True) # [!code highlight]
client = Client()
question = "What is the capital of France?"
response = client.models.generate_content(
model="gemini-2.0-flash-001",
contents=f"Answer this question: {question}",
)
print(response.text)
# > The capital of France is Paris.
```
But system-level metrics only tell part of the story. To truly understand why an LLM produced a certain response (or behaved unexpectedly) you need to trace what happened inside the call itself, not just around it.
Lilypad lets you trace the full context of a prompt by recommending you encapsulate the following in a Python function:
* The prompt text or template.
* Input arguments, including all inputs that go into a call, such as the user query, chat history, and desired response length.
* Model settings, like provider, version, `temperature`, or `top-p`.
* Helper functions or classes, such as any user-defined functions or classes within the LLM function’s scope.
* Pre- and post-processing logic, like how inputs are prepared and how outputs are parsed or validated.
* Control flow and logic, such as the code structure and any logic that affects the LLM’s behavior.
* Structured return types, such as Pydantic models, which are tracked as new versions when changed.
This gives you a full snapshot of the code context behind outputs, which in turn helps reproduce results and understand how changes impact model performance.
Once your function is set up, you then decorate it with `@lilypad.trace(versioning="automatic")`, which turns the function (and every LLM call it makes) into a versioned, traceable software artifact. Every change inside that function is automatically versioned and recorded.
```python
from openai import OpenAI
import lilypad
lilypad.configure(auto_llm=True) # [!code highlight]
client = OpenAI()
@lilypad.trace(versioning="automatic") # [!code highlight]
def answer_question(question: str) -> str:
resp = client.chat.completions.create(
model="gpt-4o",
messages=[{"role": "user", "content": f"Answer this question: {question}"}],
)
return resp.choices[0].message.content
answer = answer_question("Who painted the Mona Lisa?") # automatically versioned
print(answer)
# > The Mona Lisa was painted by the Italian artist Leonardo da Vinci.
```
This makes LLM interactions reproducible, debuggable, and easy to compare, so you can quickly identify the root cause of any unexpected behavior. You can roll back to a previous version, run A/B tests, and track performance over time without losing the thread of what changed or why. Lilypad avoids creating duplicate versions if nothing inside the function has changed, so your version history stays clean.
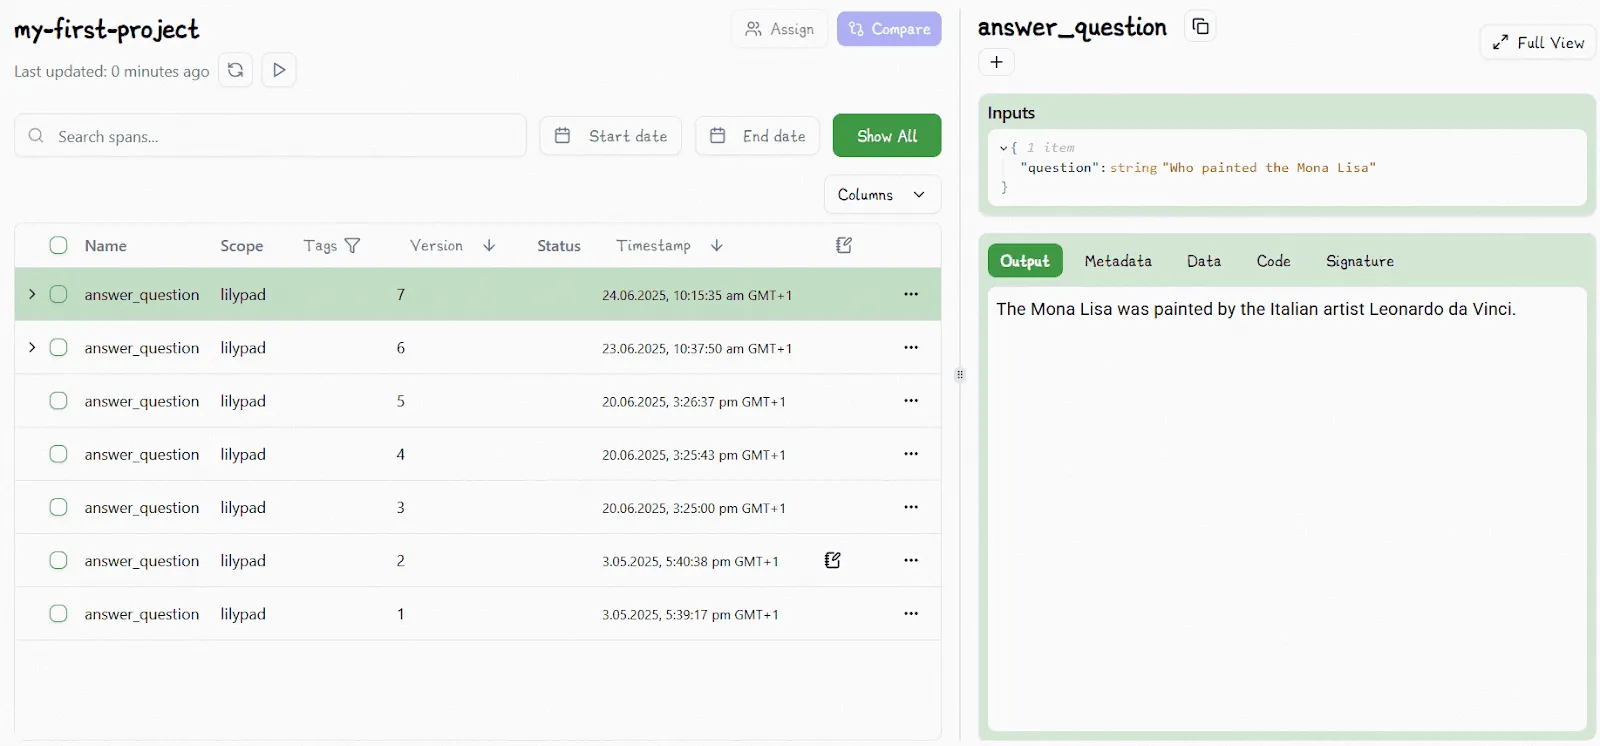
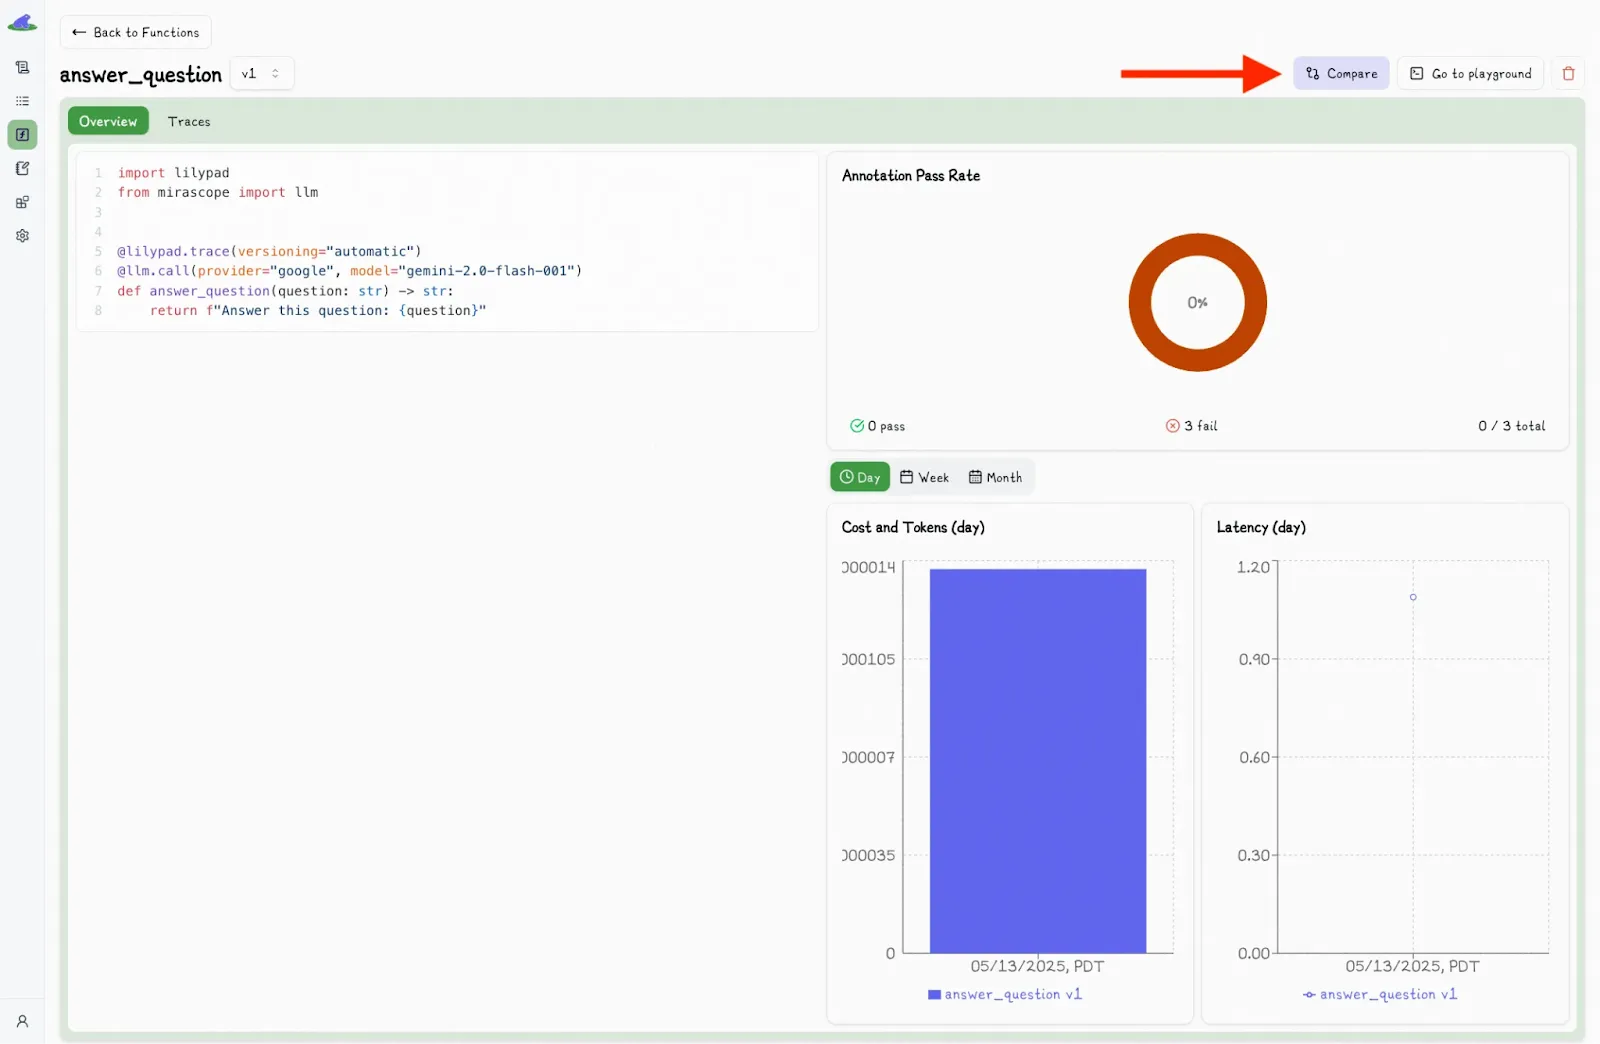
Inside the Lilypad UI, you can view side-by-side comparisons of spans and function versions and can click the “Compare” button to see exactly what was different between two runs:
You can select another version and view the differences side-by-side:
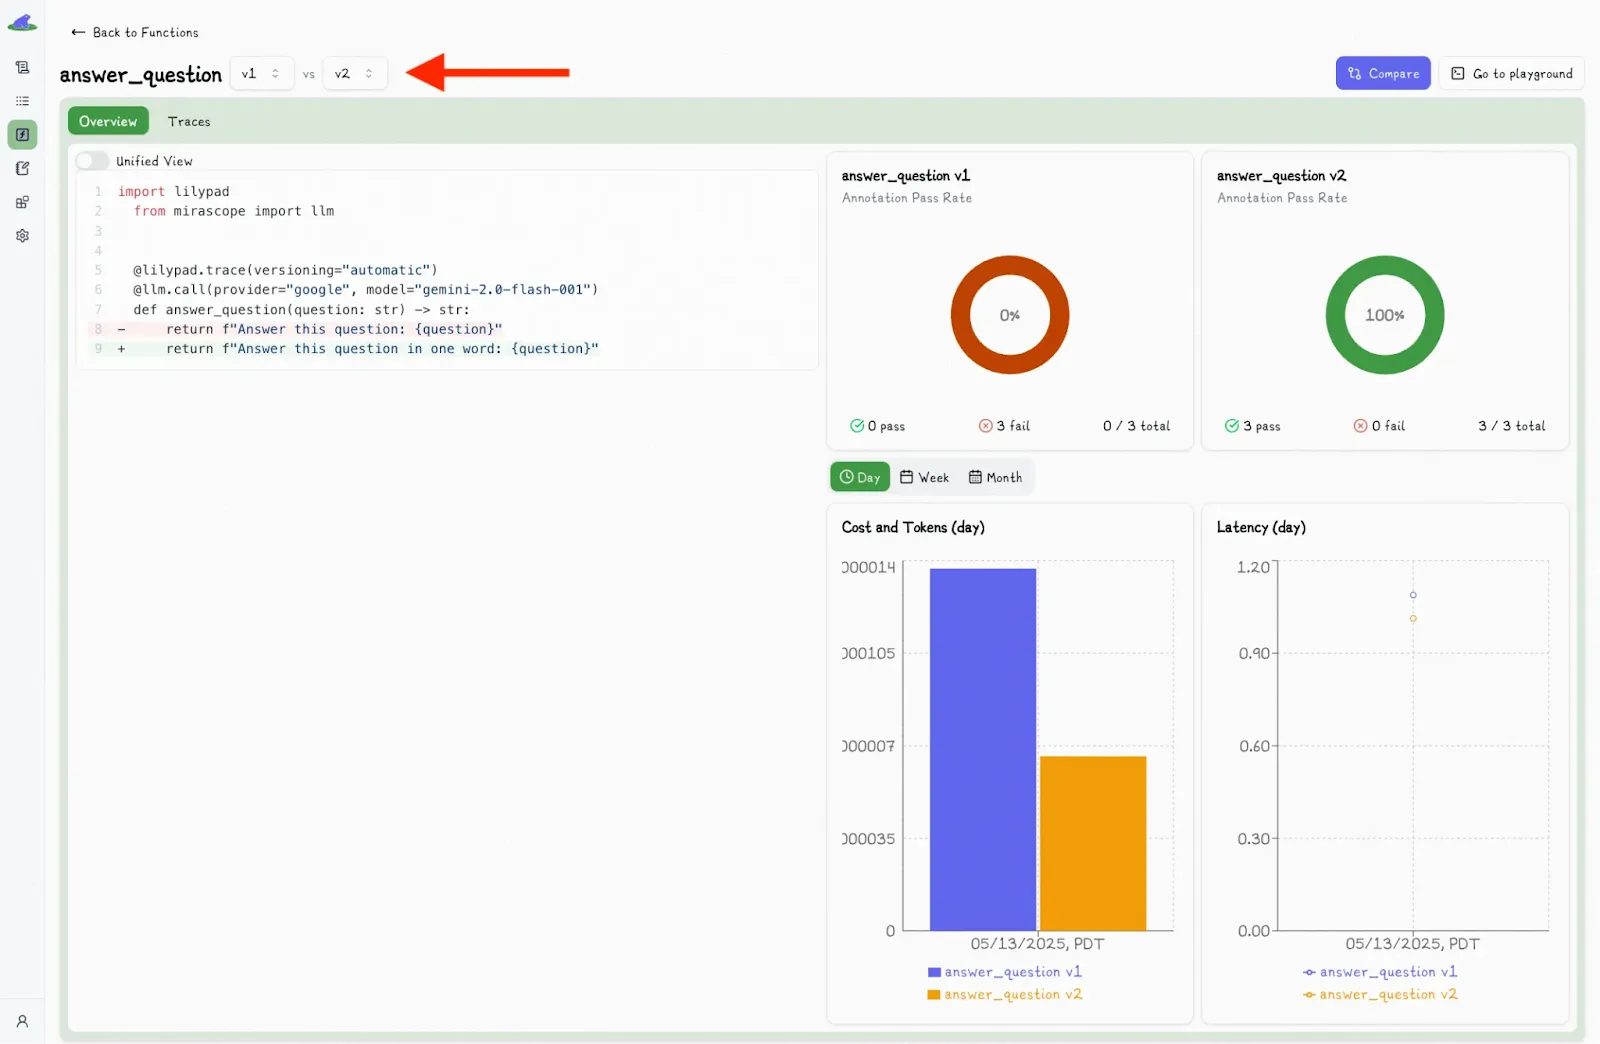
Alongside each call, the UI also shows detailed metadata, like latency, cost, and inputs, giving you full visibility into what happened and what influenced the result.
You can also work with different versions downstream using commands like `.version`, for example:
```python
response = answer_question.version(6)("Who painted the Mona Lisa?")
```
This gives you access to much of the same versioning functionality as the Lilypad UI, such as A/B testing for different subsets of users.
You can find more details on Lilypad’s observability solution and working with versions and traces in our [documentation](/docs/lilypad/observability/spans).
#### Prompt Editing and Monitoring
The Lilypad playground gives non-technical users like SMEs a simple way to edit prompts and observe how the model responds without needing to touch the underlying code.
The playground allows users to write prompt templates in markdown using typed variable placeholders for inputs. Whenever you do [prompt optimization](/blog/prompt-optimization), whether it’s rewording a sentence or changing a temperature setting, Lilypad automatically generates a new version of the underlying Python function behind the scenes.
Each time the function runs, users can monitor not only the response but also metadata like the response time, the full Python code that wrapped the LLM call, the function signature and return types, and the exact message payload that was sent to the model.
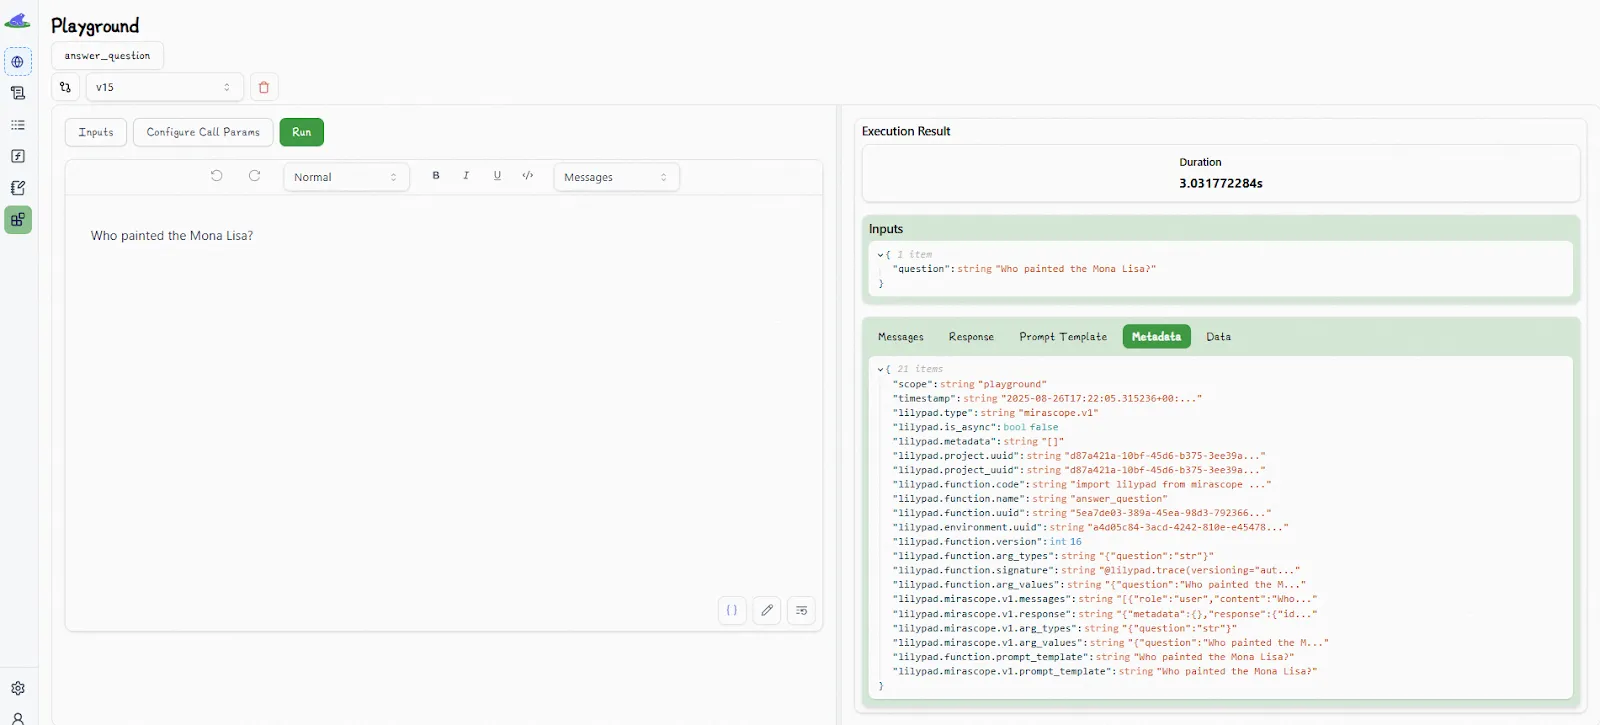
This lets you see if a change in the LLM’s response was caused by a code update, a prompt adjustment, or a different set of input arguments. Outputs aren’t just “prompt in, text out”; they’re part of a full audit trail that ties each result back to the logic that produced it.
The playground also displays the underlying Python functions (those decorated with `@lilypad.trace`) that are used in production. Even if Lilypad were to go down, your code would still run as expected.
Each prompt template is tied to a specific function signature, ensuring strong typing and reproducibility. Inputs are checked for type safety, which helps prevent common bugs like missing fields, formatting issues, or injection risks.
#### Turning Logged Runs Into Reliable Evaluation Datasets
A big part of monitoring large language models is about evaluating whether the outputs your model produces are actually any good. And because outputs are non-deterministic, systematic [LLM evaluation](/blog/llm-evaluation) provides the signal needed to judge quality, detect regressions, and guide improvements.
Lilypad’s framework simplifies the evaluation process by using a pass/fail labeling system (with reasoning), which is faster and more practical for subjective tasks like summarization or reasoning than granular scoring.
In granular scoring, for instance, evaluation metrics might include rating scale from 1 to 5. But objectively rating the difference between a 3 and 4 for any given output could be challenging. A simple binary system of “pass” or “fail” can make it easier for teams to align on what counts as “good enough” in the real world.
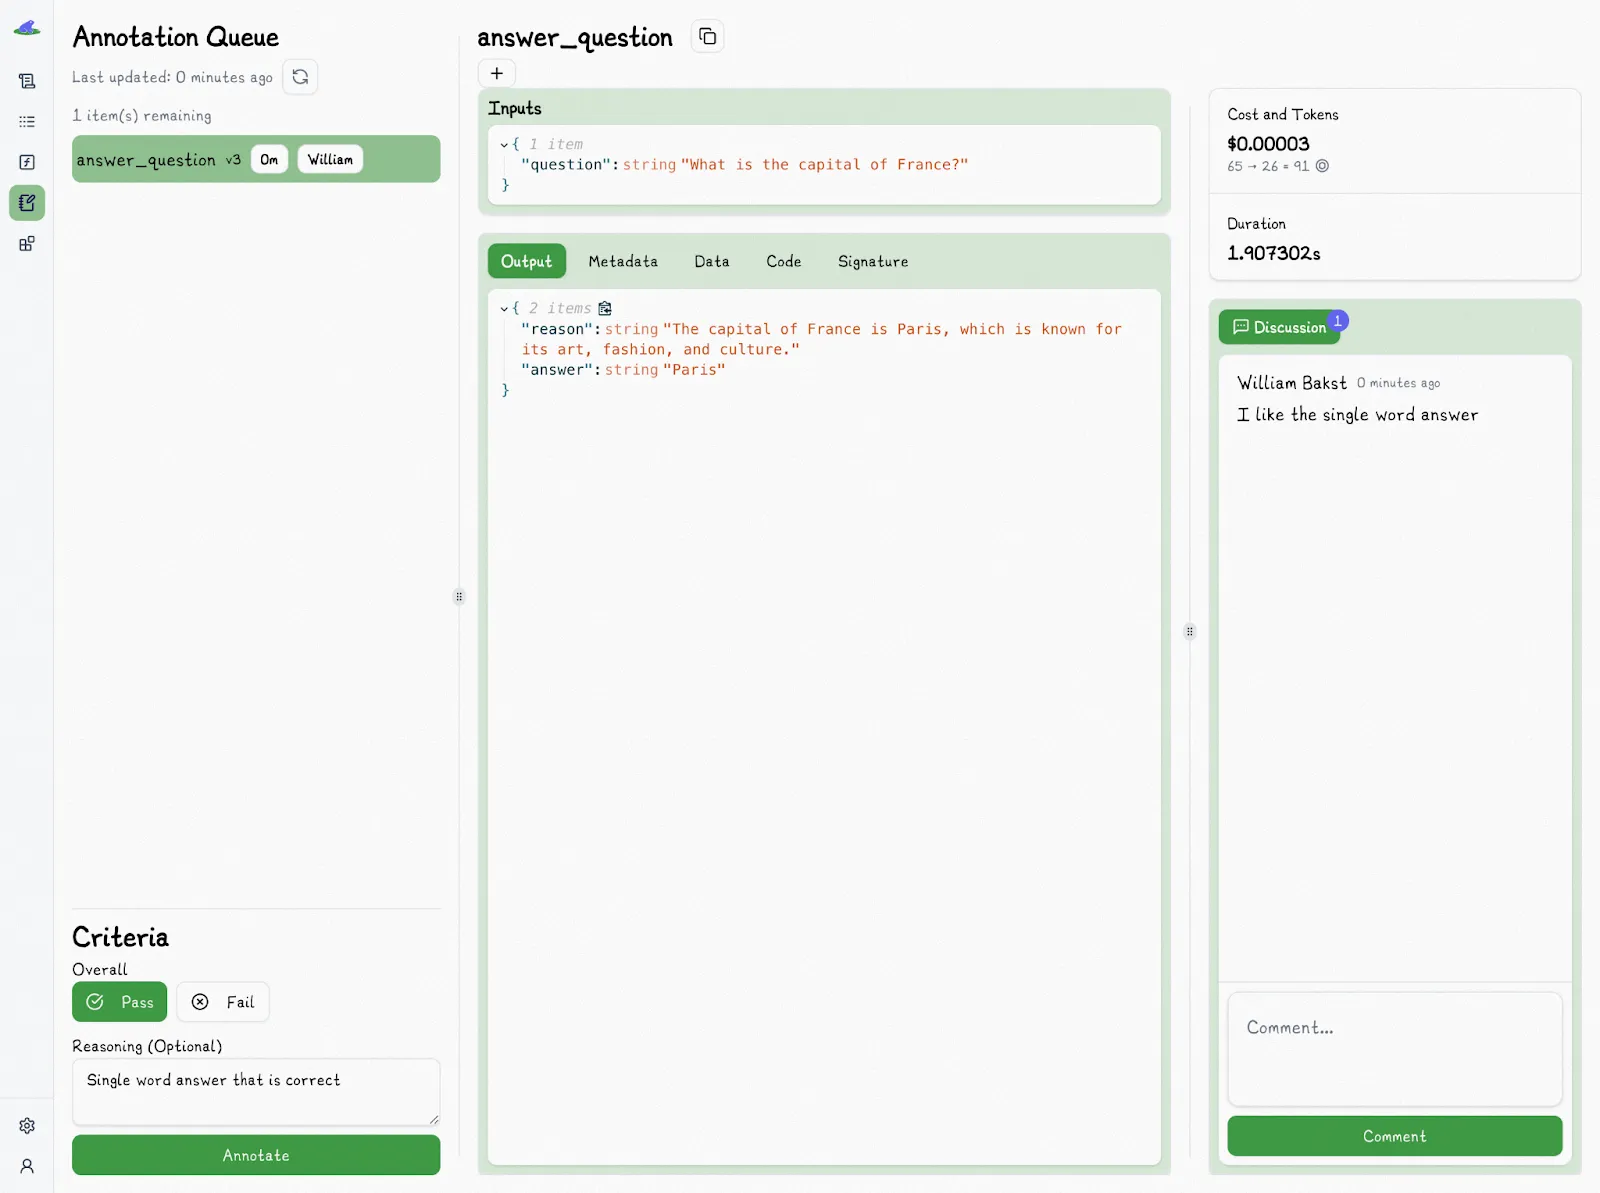
This kind of binary labeling makes it easier for domain experts to annotate outputs directly in Lilypad traces or in the playground interface, helping create a continuous feedback loop.
Each annotation is saved alongside the trace and the exact version of the function that produced it. To keep evaluations fair, Lilypad hides existing annotations when someone is reviewing a trace. That way, each reviewer gives feedback without being influenced by what others said.
Lilypad encourages manual labeling early in a project to build a strong, high-quality dataset of human-reviewed results. These labeled examples can later be used to train automated evaluators like [LLM-as-a-judge](/blog/llm-as-judge). Even with automation, though, Lilypad recommends keeping humans in the loop to verify final results.
To see for yourself how evaluations in the platform work, you can [**sign up for Lilypad**](https://lilypad.mirascope.com/) using your GitHub account and get started with versioning and monitoring your LLM calls with only a few lines of code.
### 2. Langfuse: Experimentation, Feedback, and Benchmarking for LLMs
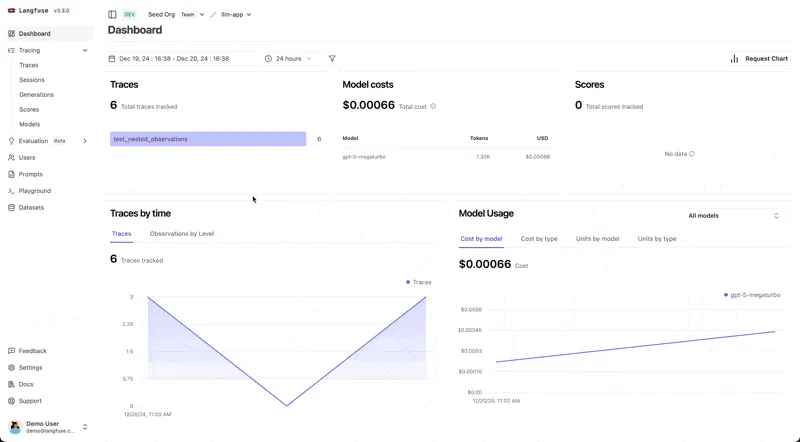
[Langfuse](https://langfuse.com/) is an observability solution that helps teams manage, track, and debug LLM workflows in production. As LLM-powered applications introduce complexities not addressed by traditional monitoring tools, Langfuse provides deep tracing, analytics, and evaluation tailored to generative AI systems.
The platform:
* Centralizes, versions, and iterates prompts, allowing collaborative testing, deployment, and refinement without introducing additional latency. Note that you must manually save prompts in Langfuse, which doesn’t offer automatic versioning.
* Supports quality evaluation of LLM outputs using user feedback, automated scoring (LLM-as-a-judge), manual labeling, and custom pipelines. Facilitates monitoring and improvement of answer quality over time.
* Enables structured experiments, dataset management, and test benchmarking before deploying new versions, helping prevent regressions or performance drops.
* Can be self-hosted for secure handling of sensitive data or used as a managed service with a free tier.
### 3. Phoenix (by Arize): A Monitoring Tool Designed for Experimentation and Debugging
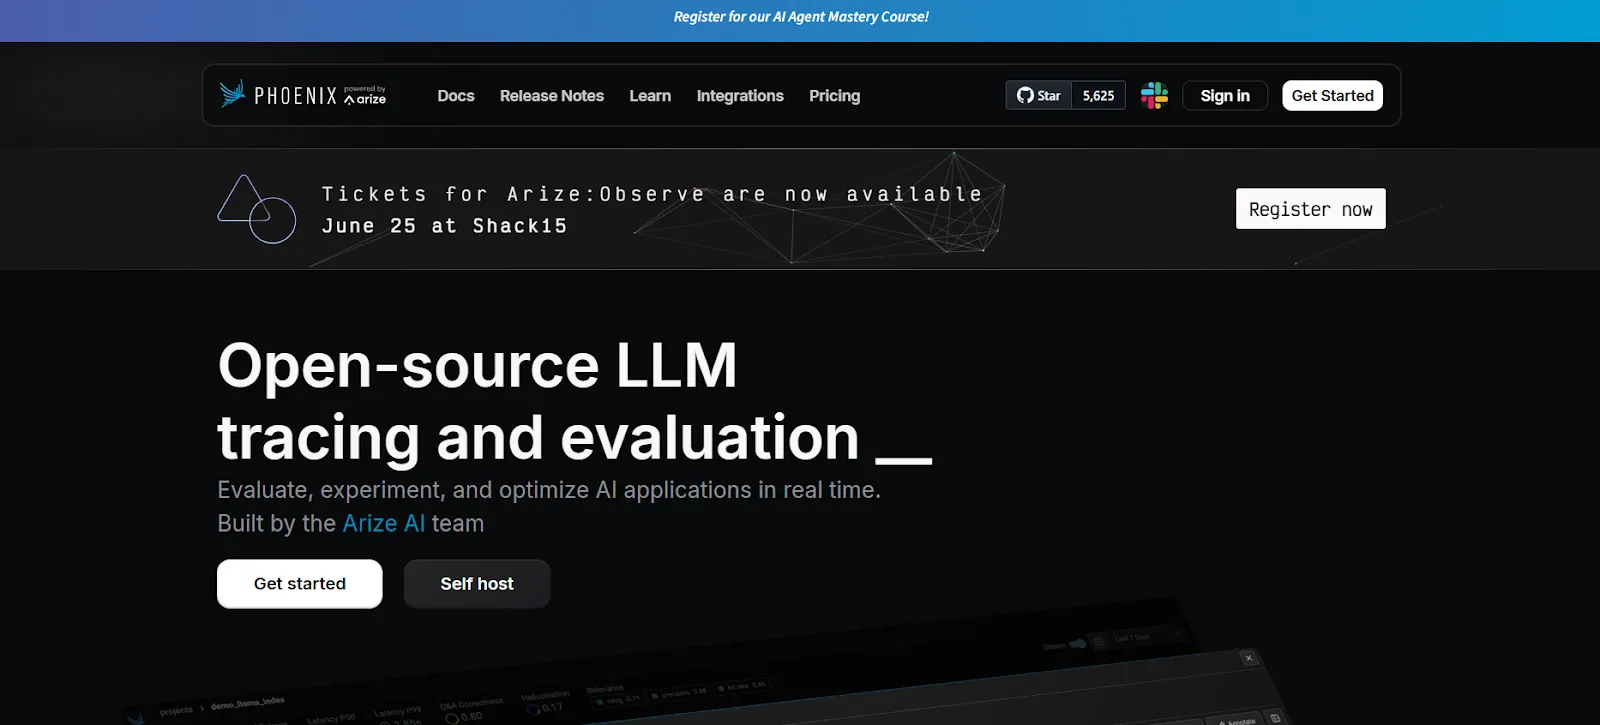
[Phoenix](https://phoenix.arize.com/) automatically traces requests and responses handled by LLM workflows and records metrics (like latency and token usage). It also collects contextual metadata, parameters, errors, prompt information, and retrieved documents.
This data lets teams pinpoint issues, visualize execution flow, and optimize model outputs. The tool is designed to facilitate experimentation, evaluation, and debugging of LLM applications across various frameworks and providers.
Phoenix:
* Tracks every step in a workflow, including input, output, timing, parameters, prompt templates, and exceptions, using spans and traces.
* Supports LLM- and code-based evaluations to benchmark performance, response quality, and retrieval accuracy. It also integrates with external evaluators like Deepeval and Ragas.
* Allows comparison of different prompts, models, parameters, and retrieval configurations, supporting scalability systematic experimentation for LLM applications.
* Enables creation and management of datasets for testing, evaluation, and fine-tuning, ensuring reproducibility and robust performance analysis.
* Users can attach human ground-truth labels for supervised evaluation and tuning.
### 4. Helicone: A Monitoring Hub for Performance, Cost, and Accuracy
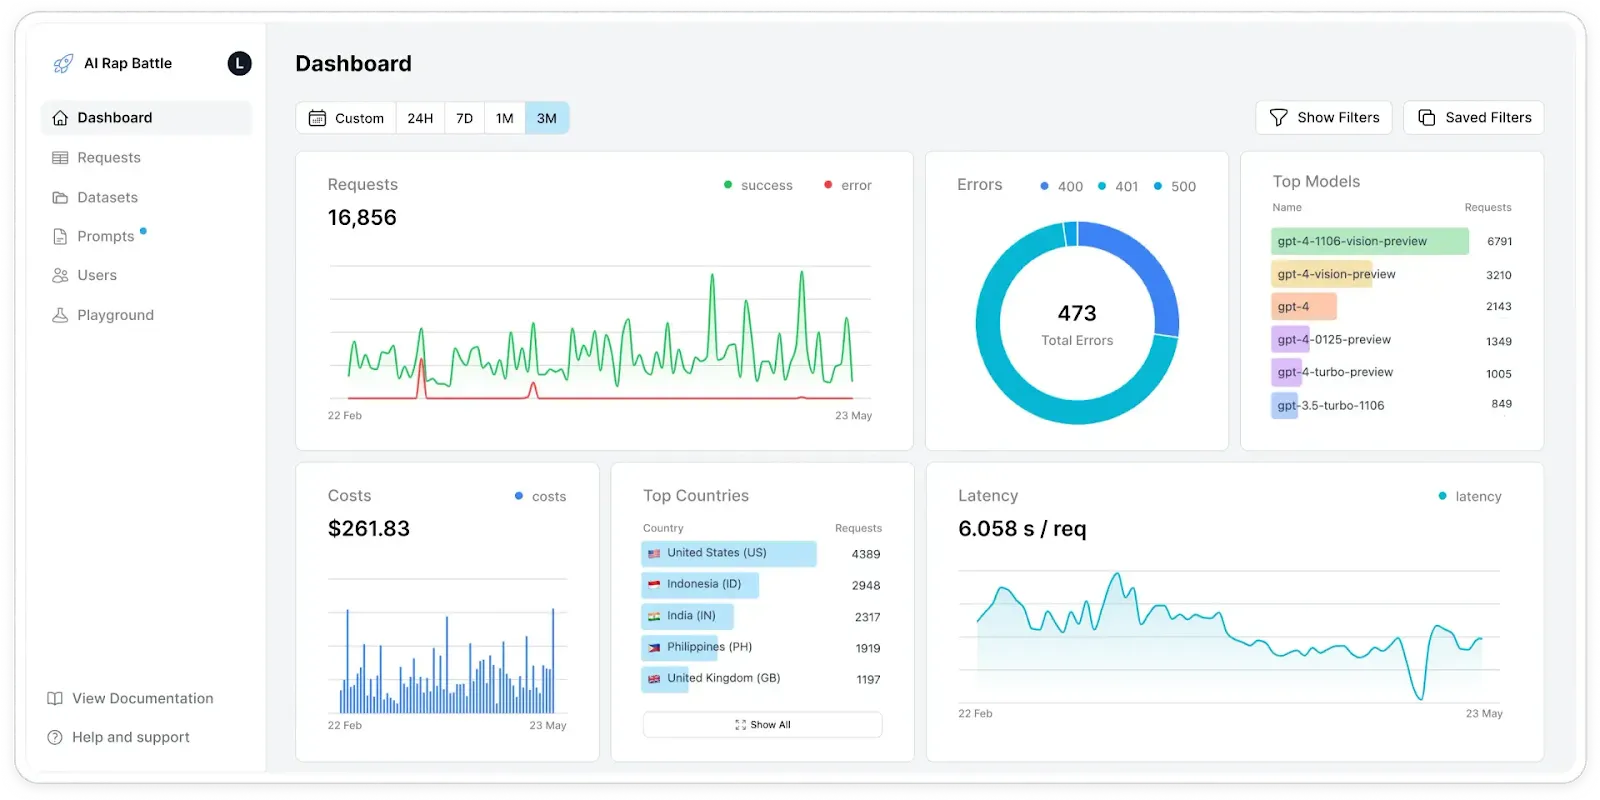
[Helicone](https://www.helicone.ai/) logs requests and responses, enabling real-time and historical analysis of LLM performance. This helps developers ensure performance, security, cost-efficiency, and output quality as LLM applications scale and become more complex.
The platform:
* Provides an observability solution that logs full prompt and completion pairs, capturing key metadata such as latency, time to first token, costs, input/output tokens, etc.
* Groups related requests by session and allows visualization of complex, multi-step LLM interactions, which is important for scalability and debugging agent workflows and chained LLM calls.
* Breaks down costs per request, user, or project and provides insights into token consumption to help manage and optimize expenses.
* Tracks system latency, time to first token (TTFT), total response times, and other performance KPIs for prompt responsiveness and end-user experience.
* Supports automated and manual evaluation of LLM responses with LLM-as-judge approaches or user feedback, making it easier to detect accuracy regressions and output quality issues.
### 5. Opik: Continuous Evaluation and Real-Time LLM Monitoring
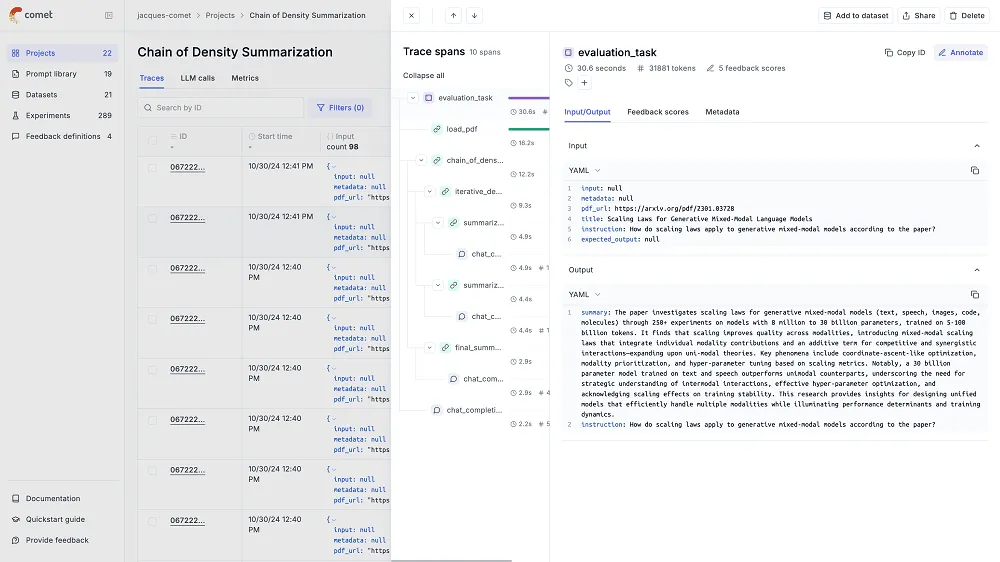
[Opik](https://www.comet.com/site/products/opik/) provides observability and continuous evaluation of LLM performance. It allows real-time tracking of LLM interactions, detecting issues such as hallucinations, unintended behaviors, and performance degradations immediately. The platform supports complex multi-step agent workflows, making it suitable for advanced applications like retrieval augmented generation (RAG) systems and [LLM agents](/blog/llm-agents).
Key features include:
* Trace logging of LLM calls, prompts, responses, and intermediate steps within agentic workflows, enabling precise debugging and system understanding.
* Visualization of system health, feedback scores, token usage, anomaly detection, and performance metrics live to catch problems early.
* Automatic detection of when the LLM produces inaccurate or fabricated content, alerting developers to fix issues promptly.
* Automated and human-in-the-loop evaluations with domain-specific evaluation metrics for relevance, coherence, safety, and moderation.
* Compatibility with standard testing frameworks like Pytest, enabling continuous integration and scalability of CI/CD processes.
* Tracking of multi-agent decision-making processes, tool usage, and interactions to optimize complex AI systems.
### 6. Lunary: A Full-Stack Monitoring Toolkit for LLMs
[Lunary](https://lunary.ai/) is a production toolkit and observability platform specifically designed for monitoring and managing LLM applications, including chatbots and AI agents. It allows AI developers to capture, analyze, and improve AI interactions across their entire stack with [LLM tools](/blog/llm-tools) for debugging, analytics, prompt management, security, and collaboration.
Key features include:
* Logging of all user prompts and model responses, allowing teams to review, replay, and evaluate how agents perform in production.
* Capture of traces, error stack traces, and relevant logs to help identify and resolve issues efficiently.
* Tracking of model usage metrics such as latency, token consumption, costs, and user satisfaction. Custom dashboards allow detailed performance visualization.
* Support for prompt templates, versioning, collaboration with non-technical teammates, and A/B testing to continuously refine prompts.
* Enables team members to manually rate and judge LLM responses for quality assurance and improvement.
* Can be deployed in your cloud environment, providing maximum control over data and infrastructure.
## Unlock True LLM Observability
LLM monitoring isn’t just about numbers; it’s about context. Lilypad’s collaborative playground turns every call into a data point you can annotate, compare, and improve with your team. Align engineers and domain experts on what “good” looks like and build better prompts, faster.
Want to learn more about Lilypad? Check out our code samples in our [docs](/docs/lilypad) or on [GitHub](https://github.com/mirascope/lilypad). Lilypad offers first-class support for [Mirascope](/docs/mirascope), our lightweight toolkit for building LLM agents.
LLM Monitoring Tools: 6 Open Source Alternatives You Should Know
2025-09-19 · 8 min read · By William Bakst